
Mô tả
Bộ Phân Tích Pullback Xu Hướng
Bộ Phân Tích Pullback Xu Hướng là một chỉ báo cTrader được xây dựng để phân tích cách một xu hướng thở bằng cách đo độ sâu và tần suất các lần pullback – hiện nay cũng có trong phần trăm thoái lui Fibonacci.
Sử dụng bộ lọc xu hướng dựa trên EMA, chỉ báo:
- phát hiện khi có một xu hướng tăng hoặc xu hướng giảm rõ ràng đang diễn ra;
- xác định từng pullback được xác nhận trong xu hướng đó;
- đo lường độ sâu pullback tính bằng pip;
- tính toán phần trăm thoái lui theo kiểu Fibonacci so với chân đòn bẩy cuối cùng;
- theo dõi trực tiếp:
-
- có bao nhiêu lần pullback đã xảy ra trong xu hướng hiện tại,
- độ sâu pullback cuối cùng,
- độ sâu pullback trung bình,
- phần trăm thoái lui Fibonacci cuối cùng.
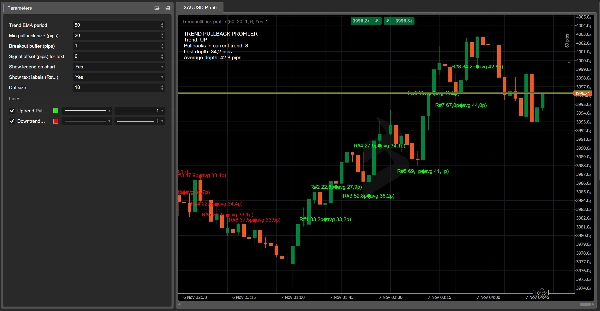
Trên biểu đồ, nó:
- vẽ một chấm xanh lớn tại đáy của pullback trong một xu hướng tăng,
- một chấm đỏ lớn tại đỉnh của pullback trong một xu hướng giảm,
- tùy chọn in nhãn gọn như:
22.5 p / 38.2%.
Ở góc trên bên trái, một bảng chú giải động hiển thị:
- hướng xu hướng hiện tại (TĂNG / GIẢM / KHÔNG);
- số lần pullback trong xu hướng hiện tại;
- độ sâu pullback cuối cùng (tính bằng pip);
- độ sâu pullback trung bình (tính bằng pip);
- phần trăm thoái lui Fibonacci cuối cùng.
Các Tham Số Chính
- Chu kỳ EMA xu hướng
Chu kỳ EMA dùng để xác định hướng xu hướng. - Kích thước pullback tối thiểu (pip)
Độ sâu pullback tối thiểu cần thiết (tính bằng pip) để được tính là một lần thoái lui hợp lệ. - Đệm phá vỡ (pip)
Khoảng cách thêm mà giá phải di chuyển vượt quá cực điểm xu hướng trước đó để xác nhận một chân mới và đóng pullback. - Độ lệch tín hiệu (pip) cho văn bản
Độ lệch theo chiều dọc cho nhãn văn bản so với đỉnh/đáy pullback. - Hiển thị chú giải trên biểu đồ
Bật/tắt chú giải trên biểu đồ với các chỉ số xu hướng, lần cuối và trung bình. - Hiển thị nhãn văn bản gần các chấm
Nếu bật, in nhãn nhỏ bên cạnh chấm với độ sâu pullback (và tùy chọn phần trăm Fibonacci). - Hiển thị phần trăm Fibonacci trong nhãn
Nếu bật, hiển thị cả pip và phần trăm Fibonacci trong nhãn (XX.Xp / YY.Y%). - Kích thước chấm
Điều khiển kích thước chấm xuất hiện trên biểu đồ, giúp dễ dàng nhận biết pullback ngay cả trên các khung thời gian thấp hơn.
Các trường hợp sử dụng thực tế
- Phân tích trực quan độ sâu pullback thường thấy trên một cặp ký hiệu/khung thời gian nhất định.
- Lập kế hoạch các điểm vào lệnh giới hạn quanh các vùng thoái lui điển hình thay vì các mức ngẫu nhiên.
- Phát hiện các pullback sâu bất thường (ví dụ, vượt quá 61.8% hoặc 78.6%) có thể báo hiệu sự kiệt sức xu hướng hoặc khả năng đảo chiều.
- Thêm thông tin pullback và Fibonacci khách quan, số học vào sổ tay giao dịch theo xu hướng của bạn.
Cách tính phần trăm thoái lui Fibonacci trong Bộ Phân Tích Pullback Xu Hướng
Bộ Phân Tích Pullback Xu Hướng tính phần trăm thoái lui theo kiểu Fibonacci dựa trên chân đòn bẩy cuối cùng của xu hướng, không dựa trên các đỉnh và đáy tùy ý.
Trong xu hướng tăng
- Chỉ báo theo dõi một chân đòn bẩy từ:
-
- Giá cơ sở xu hướng = đáy quan trọng cuối cùng (kết thúc pullback trước đó)
- Cực điểm xu hướng = đỉnh swing cuối cùng của xu hướng
- Khi một pullback hình thành, chỉ báo đo lường:
-
- Độ sâu pullback (giá):
depthPrice = trendHigh – pullbackLow - Kích thước chân đòn bẩy:
legSize = trendHigh – trendBasePrice
- Độ sâu pullback (giá):
- Phần trăm thoái lui Fibonacci là:
Fib% = (depthPrice / legSize) * 100
Vì vậy, nếu giá giảm trở lại khoảng 38.2%–50% của chân đòn bẩy cuối cùng trước khi tiếp tục tăng, bạn sẽ thấy các giá trị gần với 38.2%, 50%, 61.8%, v.v.
Trong xu hướng giảm
- Chân đòn bẩy chạy từ:
-
- Giá cơ sở xu hướng = đỉnh quan trọng cuối cùng (kết thúc pullback trước đó)
- Cực điểm xu hướng = đáy swing cuối cùng của xu hướng
- Pullback đi lên ngược xu hướng, và chỉ báo đo lường:
-
- Độ sâu pullback (giá):
depthPrice = pullbackHigh – trendLow - Kích thước chân đòn bẩy:
legSize = trendBasePrice – trendLow
- Độ sâu pullback (giá):
- Công thức giống nhau:
Fib% = (depthPrice / legSize) * 100
Bằng cách này, mỗi chấm bạn thấy trên biểu đồ đại diện cho một lần pullback bên trong một chân đòn bẩy rõ ràng của xu hướng hiện tại, được biểu thị cả bằng pip và phần trăm Fibonacci, giúp bạn nhanh chóng đánh giá xem một lần thoái lui là nông, điển hình hay sâu bất thường.
Tóm tắt
Key features include:
- Detection of trend direction and pullbacks.
- Measurement of pullback depth and Fibonacci retracement percentage.
- Live tracking of the number of pullbacks, last pullback depth, average pullback depth, and last Fibonacci retracement percentage.
- Visual chart elements such as large green dots at pullback lows in uptrends and large red dots at pullback highs in downtrends.
- Optional compact labels displaying pullback depth and Fibonacci percentage.
- A dynamic legend showing current trend direction, pullback counts, and metrics.
The Fibonacci retracement is calculated based on the last impulse leg, defined by the last significant trend base and extreme prices, providing objective numeric data to assess whether retracements are shallow, typical, or unusually deep. The indicator supports various markets including Forex, indices, commodities, cryptocurrencies, and stocks. It offers configurable parameters such as EMA period, minimum pullback size, breakout buffer, and display options for labels and legend.
Đánh giá của khách hàng
5 | 50 % | |
4 | 50 % | |
3 | 0 % | |
2 | 0 % | |
1 | 0 % |


![Logo "[Stellar Strategies] MARSI Signal Plotter"](https://cdn.ctrader.com/image/webp/7b2b8da6-8f8e-4646-8d4a-4710c516c01e_25567)
