Descrizione
Concetti di Smart Money — panoramica generale
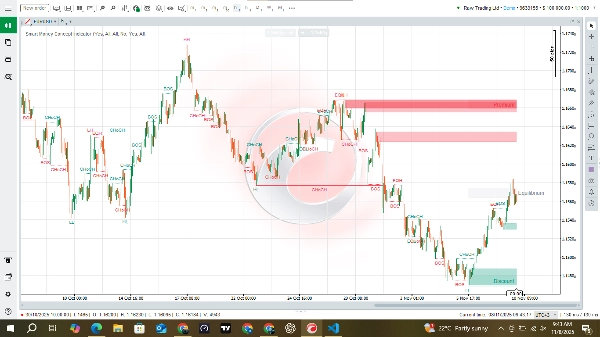
Smart Money Concepts visualizza dove l'attività professionale / istituzionale ha probabilmente influenzato il prezzo. Identifica automaticamente la struttura del mercato (struttura swing e a breve termine), evidenzia le rotture di struttura (BOS) e i cambiamenti di carattere (CHoCH), trova massimi/minimi uguali, individua intervalli candidati di order-block (aree in cui i grandi operatori potrebbero aver piazzato ordini) e dipinge zone contestuali (premium, equilibrio, sconto). Si adatta alla volatilità del mercato in modo che le sue soglie si adeguino all'attività corrente dello strumento.
Cosa ottengono i trader a colpo d'occhio
- Etichette chiare che mostrano quando la struttura si inverte o viene rotta (aiutandoti a determinare il bias).
- Aree di order-block evidenziate — potenziali zone di offerta/domanda dove il prezzo spesso effettua retest.
- Indicatori di massimi/minimi uguali — probabilmente nodi di liquidità per cacce agli stop o retest.
- Zone contestuali — premium (costoso), equilibrio (valore equo), sconto (economico) — utili per bias e obiettivi.
- Massimi e minimi forti/deboli in scia che mostrano estremi significativi recenti.
Perché questo è utile per i trader SMC
- Accelera l'identificazione dei livelli: disegna e memorizza i livelli così non devi cercare manualmente pivot e OB.
- Coerenza: applica le stesse regole per individuare inversioni di struttura e candidati OB tra strumenti e timeframe.
- Ingressi contestuali: mostra dove potrebbe esserci interesse istituzionale — i trader possono pianificare ingressi sui retest di quelle aree invece di indovinare.
- Inquadramento del rischio: le zone e i bordi degli OB offrono luoghi logici per stop e obiettivi (es. stop oltre un minimo/massimo OB).
- Flusso di lavoro multi-scala: usa la struttura su scala maggiore per il bias e la struttura interna più piccola per ingressi precisi.
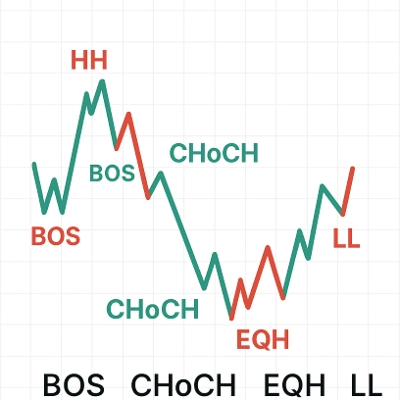
Come interpretare gli elementi principali
- BOS (Break of Structure) — segnale di continuazione nella direzione della rottura; utile per confermare il trend.
- CHoCH (Change of Character) — indicazione che il comportamento del mercato potrebbe invertire; trattalo come potenziale inversione o cambiamento di bias.
- Order Blocks (OBs) — intervalli di prezzo dove probabilmente si sono accumulati ordini più grandi; aspettati retest e rifiuti lì.
- Massimi/minimi uguali — livelli ripetuti dove si accumula liquidità; spesso presi di mira prima di grandi movimenti.
- Premium/Equilibrio/Sconto — una semplice mappa di valore: il premium favorisce i venditori, lo sconto favorisce gli acquirenti, l'equilibrio è neutro/media.


![Logo di "[Stellar Strategies] Market Session Ultimate"](https://cdn.ctrader.com/image/webp/61ffd537-0125-4246-9e72-42eca1791d64_28232)


