
说明
📜 描述
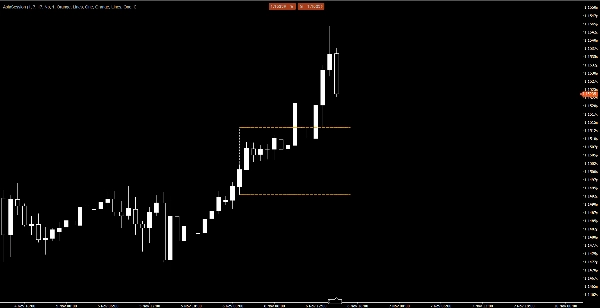
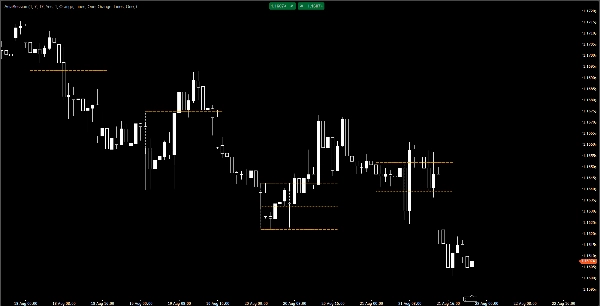
AsiaSession 指标 是 cTrader 平台的一个自定义工具,用于突出显示亚洲交易时段范围。它绘制一个完整的时段框,带有表示开始和结束时间的垂直边界线,以及表示最高、最低和中间水平的水平线。这使其特别适用于应用 智能资金概念(SMC) 和 ICT 策略 的交易者,因为亚洲时段水平通常作为流动性区域。
✨ 主要特点
- 绘制一个 完整的时段框:
-
- 左线(时段开始)
- 右线(时段结束)
- 顶线(亚洲最高价)
- 底线(亚洲最低价)
- 中线(亚洲中间价)
- 将高/低/中线延伸到未来,直到用户定义的时间
- 可配置的 颜色、样式和线条粗细
- 可选择仅显示 当前日 或包含 历史时段
- 内置 UTC 偏移 参数以调整时区
- 自动跳过周末以避免错误的时段显示
- 简洁的面向对象架构,包含枚举、辅助工具、模型和服务
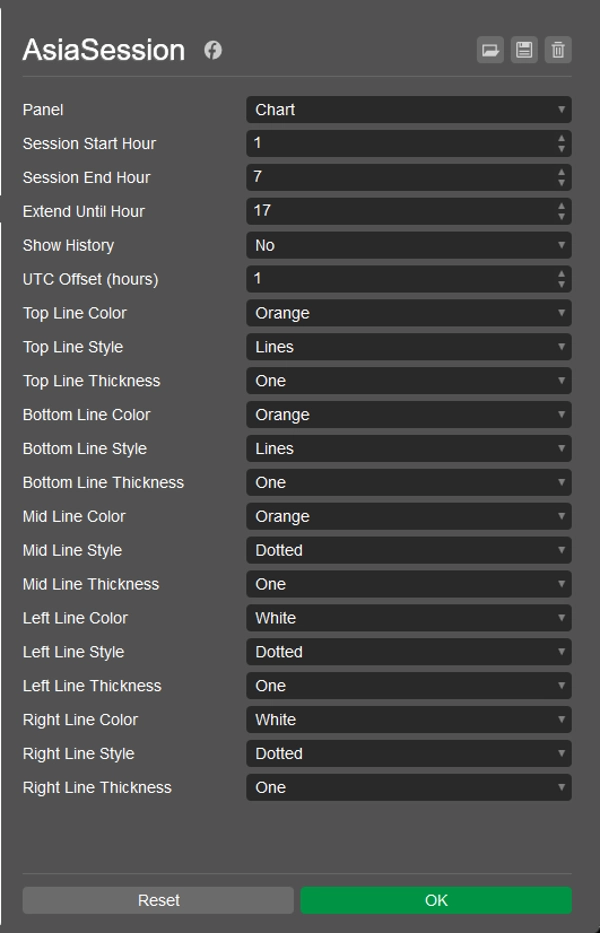
⚙️ 参数
- 时段开始小时 / 结束小时 – 定义亚洲时段边界
- 延伸至小时 – 控制线条延伸到未来的时间长度
- 显示历史 – 切换历史时段框显示
- UTC 偏移 – 调整为您的本地时区或经纪服务器时间
- 线条自定义 – 设置每个边界的颜色、样式和粗细
📈 使用方法
- 在 cTrader Automate 中安装该指标。
- 将其附加到您的图表上。
- 调整参数以匹配您的交易时区和偏好。
- 启用 显示历史 以可视化过去的时段。
📦 许可
根据 MIT 许可证 发布 – 免费使用、修改和分发。
摘要
AI 摘要
AsiaSession is a custom indicator for the cTrader platform designed to visualize the Asian trading session range. It draws a complete session box on the chart, including vertical lines marking the session start and end times, and horizontal lines indicating the session’s high, low, and mid levels. These lines can be extended into the future up to a user-defined time. The indicator supports customizable colors, styles, and thickness for each line, allowing traders to tailor the display to their preferences.
Key parameters include session start and end hours, extension duration for the lines, an option to show historical sessions or only the current day, and a built-in UTC offset for timezone adjustments. The indicator automatically skips weekends to avoid displaying false sessions. Its architecture is object-oriented, facilitating clean and efficient operation.
AsiaSession is particularly useful for traders applying Smart Money Concepts (SMC) and ICT strategies, where Asian session levels often serve as liquidity zones. Installation involves adding the indicator to cTrader Automate and configuring parameters to match the trader’s timezone and preferences. The product is published under the MIT License, permitting free use, modification, and distribution.
指标配置
客户评价
0.0
评价:0
客户评价
该产品尚无评价。已经试过了?抢先告诉其他人!
讨论
常见问答
Forex
EURUSD
SMC
cTrader Store 提供的所有产品,包括交易机器人、指标和插件,均由第三方开发者提供,仅供信息参考和技术访问之用。cTrader Store 并非经纪商,不提供投资建议、个人推荐或任何未来业绩保证。
该作者的其他作品

猜您喜欢


!["[Stellar Strategies] Inside Bar with Signals" 标识](https://cdn.ctrader.com/image/webp/1d9e8bfa-3b2c-4440-bb37-5856902008a7_30683)


价格
注册日期 24/09/2025
369
免费安装