
说明
📜 描述
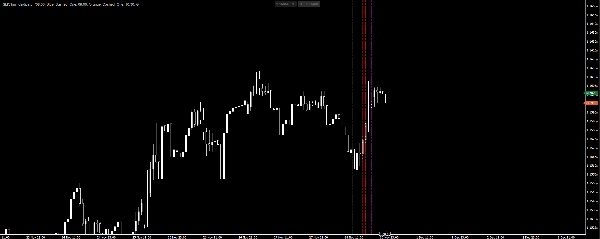
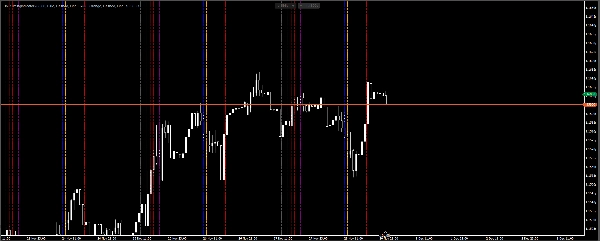
SMC Timing Indicator 是一个可定制的 cTrader 平台工具,帮助交易者可视化日内时机和市场交易时段结构。它专为应用 Smart Money Concepts (SMC) 和 ICT 策略 的交易者设计,精准的时机把握至关重要。
✨ 主要特点
- 每天最多 8 条可配置的垂直线
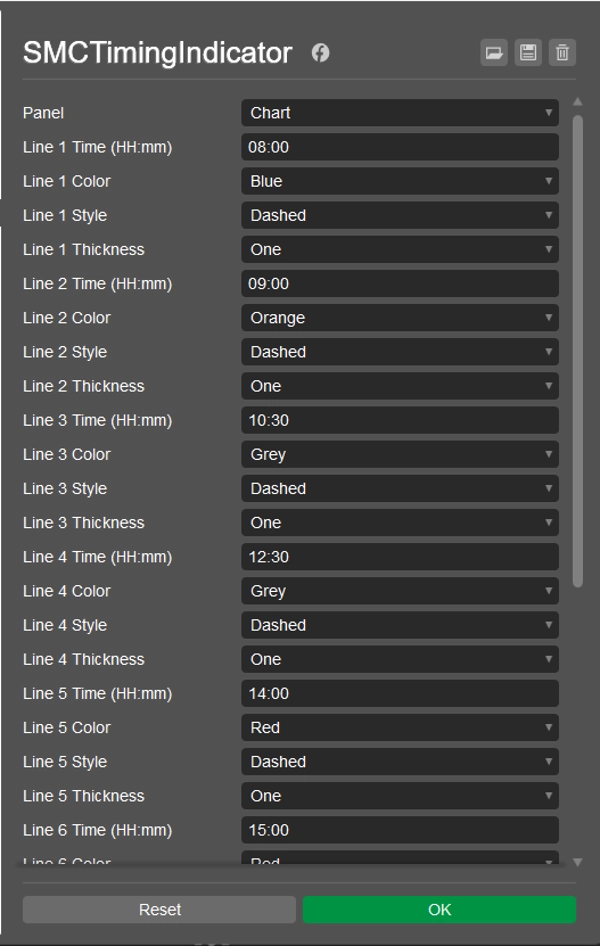
- 每条线的 时间、颜色、样式和粗细 完全可自定义
- 可选择显示 历史线条,覆盖之前的交易日
- UTC 偏移参数,实现灵活的时区对齐
- 采用枚举、辅助工具和服务的简洁模块化架构
- 开源且免费 使用和分享
⚙️ 参数
每条线都有自己的一组参数(时间、颜色、样式、粗细),允许您根据交易需求定制指标。
📈 使用方法
- 在 cTrader Automate 中安装该指标。
- 配置线条的时间和样式。
- 调整 UTC 偏移 以匹配您的本地时区或经纪商服务器时间。
- 启用 显示历史线条,以可视化过去的交易时段时间。
📦 许可证
根据 MIT 许可证 发布 – 免费使用、修改和分发。
摘要
AI 摘要
SMC Timing Indicator is a customizable indicator for the cTrader platform designed to mark trading sessions with vertical lines. It supports up to eight configurable vertical lines per day, each with adjustable time, color, style, and thickness settings. The indicator includes a UTC offset parameter to align session times with different time zones or broker server times. Users can enable the display of historical session lines to visualize past trading days. The tool is particularly suited for traders using Smart Money Concepts (SMC) and ICT strategies, where precise intraday timing and market session structure visualization are important. It features a modular architecture and is published under the MIT License, allowing free use, modification, and distribution. Installation and configuration are done through cTrader Automate.
指标配置
客户评价
0.0
评价:0
客户评价
该产品尚无评价。已经试过了?抢先告诉其他人!
讨论
常见问答
Forex
EURUSD
SMC
cTrader Store 提供的所有产品,包括交易机器人、指标和插件,均由第三方开发者提供,仅供信息参考和技术访问之用。cTrader Store 并非经纪商,不提供投资建议、个人推荐或任何未来业绩保证。
该作者的其他作品


价格
注册日期 24/09/2025
369
免费安装