Descrizione
Il Vantaggio Ponderato per Volume: Una Guida Completa per il Momentum su cTrader
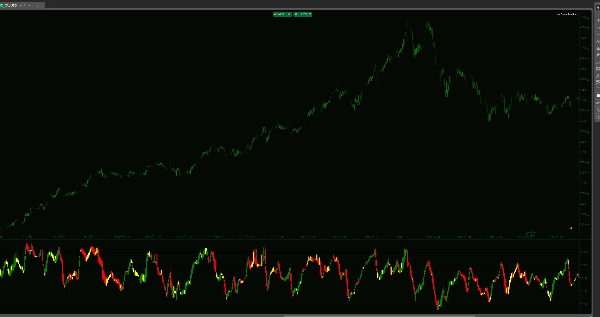
Gli indicatori standard ti mostrano dove il prezzo è stato. L'indicatore Volume-Weighted RSI Candles ti mostra la convinzione dietro il movimento. Unendo l'azione del prezzo, il volume tick e cinque livelli istituzionali critici, questo strumento trasforma l'RSI da un semplice oscillatore in un sistema completo di mappatura del trend.
Invece di una singola linea, ottieni candele OHLC complete nella finestra dell'indicatore. Questo ti permette di vedere la "struttura" del momentum—rivelando se un movimento è supportato da un volume istituzionale pesante o è semplicemente un "falso segnale" a bassa liquidità.
La Strategia di Esecuzione a 5 Zone
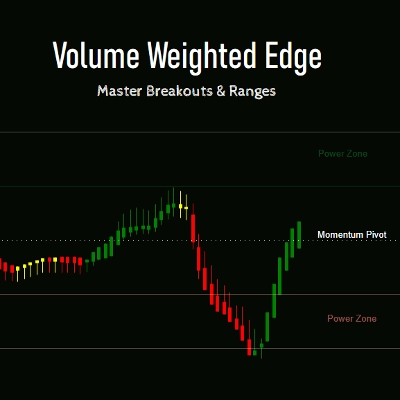
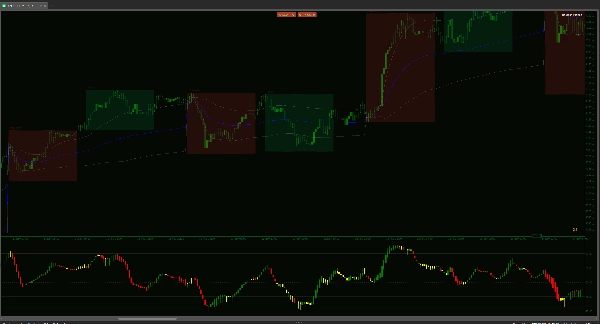
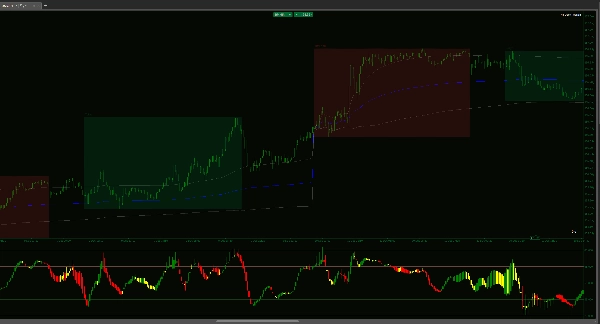
- Le Estensioni di Potenza (65–80 & 20–35): Queste sono le zone ad alta convinzione. Quando le candele ponderate per volume si mantengono qui, non cerchi inversioni—stai cavalcando il trend. Qui opera il grande denaro, e avvengono i movimenti più esplosivi.
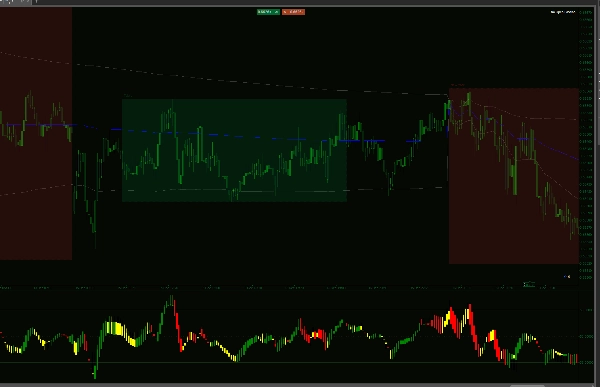
- I Corridoi di Scalping (50–65 & 35–50): Perfetti per la sessione asiatica o mercati laterali. Quando il trend su timeframe più alti è neutro, queste zone offrono obiettivi di "ritorno alla media" ad alta probabilità. Se il mercato è laterale, questi corridoi ti permettono di fare scalping sulle rotazioni con precisione chirurgica.
- Il Pivot del Momentum (50): La linea definitiva nella sabbia. Un corpo candela ponderato per volume che chiude oltre questo livello è il tuo primo avviso di un cambiamento strutturale nel controllo del mercato.
Perché Questo Strumento Cambia il Tuo Flusso di Lavoro
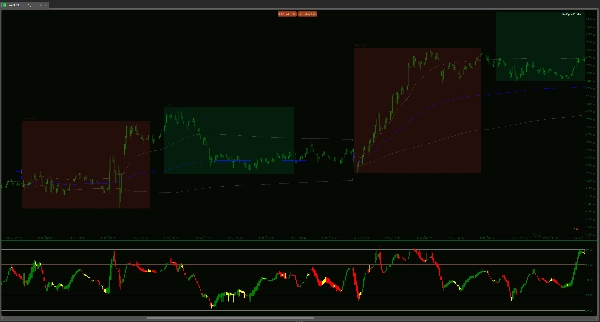
Chiarezza Ponderata per Volume: Ogni candela è calcolata moltiplicando la variazione di prezzo per il volume tick. Se un movimento avviene con volume basso, la candela RSI non lo confermerà. Questo ti tiene lontano dai movimenti "trappola" che sembrano validi sul grafico dei prezzi ma non hanno supporto.
Informazioni dal Corpo della Candela: Le linee RSI tradizionali sono nervose e frastagliate. Le nostre candele smussate con WMA ti mostrano l'"apertura" e la "chiusura" del momentum. Se il corpo della candela RSI è spesso e solido, il trend è sano. Se le ombre sono lunghe, il momentum è esaurito.
Versatilità Multi-Mercato: * Trending: Usa l'intervallo 65–80 per restare più a lungo nelle operazioni vincenti.
Laterale/Scalping: Usa i corridoi 35–65 per catturare rotazioni rapide durante sessioni a bassa volatilità come l'Asia.
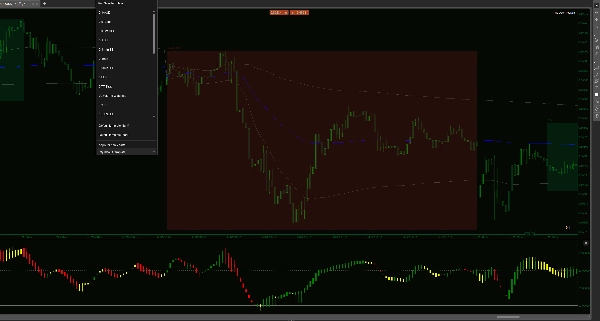
Evita la Trappola del "Barcode": La maggior parte degli indicatori ti costringe a indovinare durante i periodi di bassa volatilità. Questo indicatore presenta un effetto visivo unico a "Barcode" durante la consolidazione. Quando le candele si restringono, si appiattiscono e diventano neutrali, l'indicatore ti sta dicendo che il "motore del mercato" è spento. Questo avviso visivo ti salva dall'entrare in falsi segnali a basso volume e dall'essere "tagliato" quando non c'è denaro reale dietro il movimento del prezzo.
Ottimizzazione Nativa per cTrader: Costruito specificamente per l'API C# con la logica "Max Visual Candles" per garantire che la tua piattaforma rimanga reattiva, anche sui grafici a 1 minuto.
Smetti di fare trading basandoti su dove il mercato potrebbe andare. Inizia a fare trading basandoti su dove il volume lo sta effettivamente spingendo. Questo indicatore non riguarda solo i segnali—si tratta di comprendere l'energia interna del mercato.
Riepilogo
Recensioni dei clienti
5 | 33 % | |
4 | 67 % | |
3 | 0 % | |
2 | 0 % | |
1 | 0 % |


