
Beschreibung
📊 Übersicht
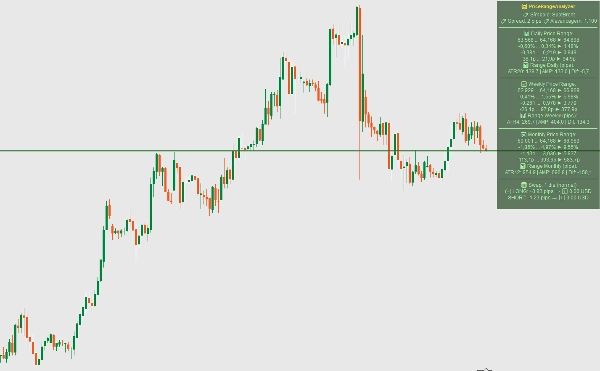
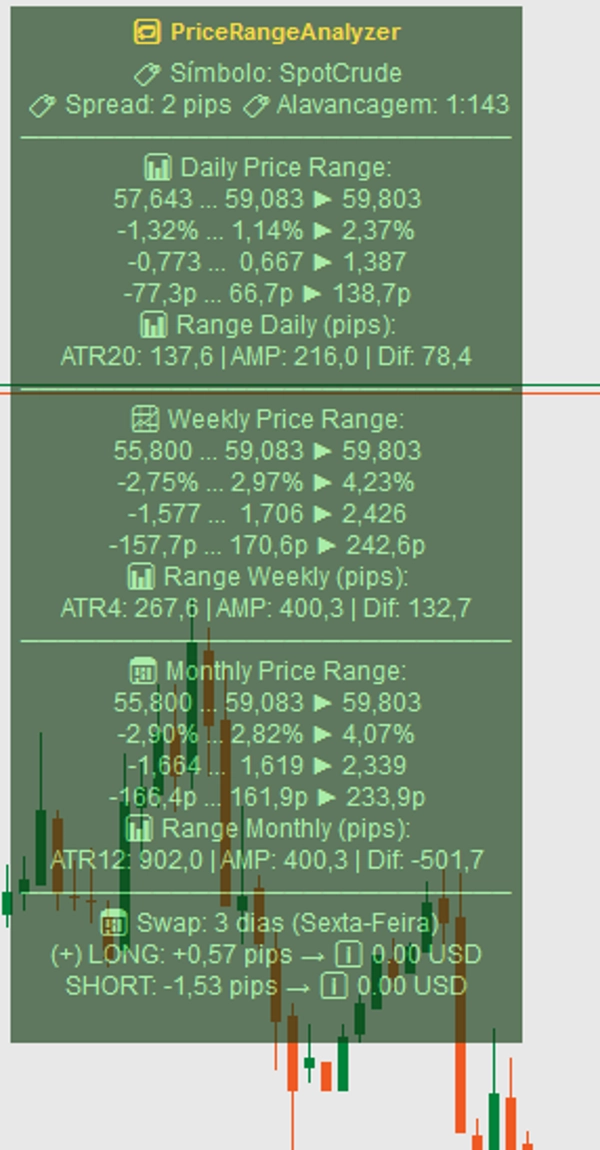
Umfassendes, mehrzeitrahmenbasiertes Handelsinformationspanel, das wesentliche Marktdaten, ATR-basierte Bereichsanalyse und intelligente Swap-Berechnungen in einer einzigen, anpassbaren Oberfläche zusammenführt. Entwickelt für ernsthafte Trader, die schnellen Zugriff auf kritische Handelskennzahlen über mehrere Zeitrahmen benötigen.
✨ Hauptfunktionen
Mehrzeitrahmenanalyse
- Tägliche, wöchentliche & monatliche Preisspannen und Schwankungen
- Gleichzeitige ATR-Berechnungen für alle Zeitrahmen mit anpassbaren Perioden
- Echtzeit-Prozent- und Pip-Änderungsberechnungen
- Visualisierung der Preisspanne mit Richtungsindikatoren
Intelligentes Swap-Management
- Automatische Erkennung des dreifachen Swaps (Mittwoch & Freitag)
- Anpassbare Symbollisten für verschiedene Swap-Zeitpläne
- Echtzeit-Swap-Berechnung für offene Positionen
- Unterstützung für %-basierte und pip-basierte Symbole
Professionelle Anzeige
- Vollständig anpassbare Panel-Position (4 Ecken)
- Dynamisches Farbschema basierend auf Marktrichtung
- Anpassbare Schriftgröße und Deckkraft
- Sauberes, organisiertes Informationslayout
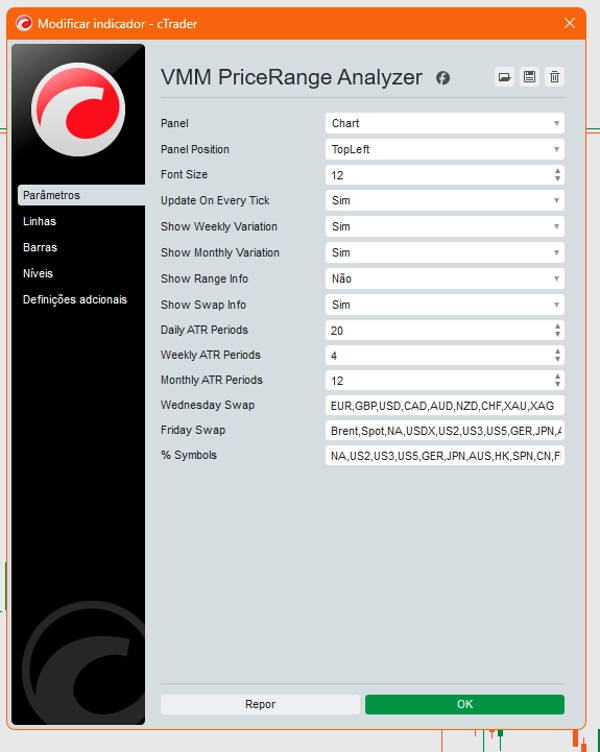
⚙️ Parameter
Panel-Konfiguration
Panel Position- Wählen Sie aus 4 Bildschirmecken (ObenLinks, ObenRechts, UntenLinks, UntenRechts)Schriftgröße- Passen Sie die Textgröße für bessere Lesbarkeit anAktualisierung bei jedem Tick- Echtzeit-Updates oder nur bei BalkenschlussWöchentliche Variation anzeigen- Wöchentliche Datenanzeige umschaltenMonatliche Variation anzeigen- Monatliche Datenanzeige umschaltenBereichsinformationen anzeigen- Detaillierte Bereichsinformationen anzeigenSwap-Informationen anzeigen- Swap-Berechnungen anzeigen
ATR-Einstellungen
Tägliche ATR-Perioden- Perioden für tägliche ATR-Berechnung (1-100)Wöchentliche ATR-Perioden- Perioden für wöchentliche ATR-Berechnung (1-100)Monatliche ATR-Perioden- Perioden für monatliche ATR-Berechnung (1-100)
Symbol-Konfiguration
Mittwoch-Swap- Komma-getrennte Symbole mit dreifachem Swap am MittwochFreitag-Swap- Komma-getrennte Symbole mit dreifachem Swap am Freitag% Symbole- Symbole, bei denen Werte prozentual statt pip-basiert sind
🔧 Funktionsweise
Bereichsanalyse
Berechnet und zeigt an:
- Aktueller Preis relativ zu täglichen/wöchentlichen/monatlichen Bereichen
- Prozentuale Veränderungen gegenüber vorherigen Schlusskursen
- Pip-Bewegungen für präzise Ein- und Ausstiegsplanung
- ATR-basierte Volatilitätsmessungen
Swap-Intelligenz
- Erkennt automatisch, wann dreifacher Swap gilt
- Berechnet Swap-Kosten für Long- und Short-Positionen
- Zeigt tatsächliche Swap-Kosten für aktuell offene Positionen
- Unterstützt verschiedene Symboltypen mit passenden Berechnungen
Visuelle Indikatoren
- Panel-Farben ändern sich basierend auf der täglichen Marktrichtung
- Grünes Panel für bullische Tage, rot für bärische
- Klare Richtungspfeile zeigen die Kursbewegung
- Organisierte Abschnitte mit Trennern für einfaches Lesen
🎯 Anwendungsfälle
Für Positions-Trader
- Überwachen von Mehrzeitrahmen-Bereichen für bessere Einstiegszeitpunkte
- Verstehen der Swap-Kosten vor dem Übernacht-Halten
- Verfolgen von wöchentlichen und monatlichen Kursentwicklungen
Für Day-Trader
- Schneller Zugriff auf Spread- und Hebelinformationen
- Überwachen des täglichen Bereichs und ATR zur Volatilitätsbewertung
- Planen von Trades basierend auf täglichen Hoch-/Tiefständen
Für alle Trader
- Konsolidierte Ansicht kritischer Handelskennzahlen
- Vermeidung kostspieliger Fehler bei Swap-Berechnungen
- Professionelle, saubere Oberfläche, die Bildschirmplatz spart
📈 Vorteile
- Zeitersparnis - Alle wichtigen Infos an einem Ort
- Fehlervermeidung - Automatische Swap-Berechnungen
- Bessere Entscheidungen - Mehrzeitrahmen-Perspektive
- Anpassbar - Passt sich Ihrem Handelsstil an
- Professionell - Saubere, institutionelle Anzeige
⚡ Leistung
- Optimiert für minimalen CPU-Verbrauch
- Aktualisiert nur bei Bedarf (konfigurierbar)
- Effizientes Speichermanagement für lang laufende Sitzungen
Perfekt für Trader, die professionelle Marktinformationen ohne Wechsel zwischen mehreren Fenstern oder Rechnern wünschen!
Zusammenfassung
Kundenbewertungen
5 | 100 % | |
4 | 0 % | |
3 | 0 % | |
2 | 0 % | |
1 | 0 % |


