
Descrizione
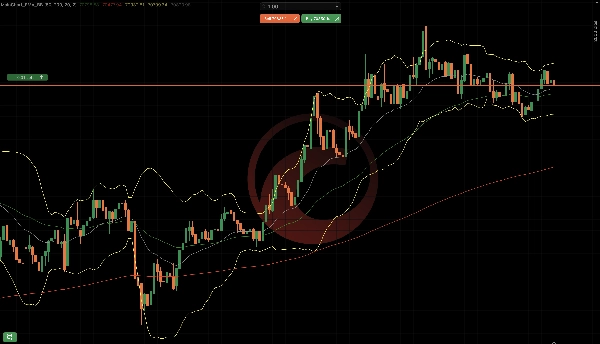
MainChart_EMA_BB è un indicatore sovrapposto al grafico principale per cTrader che combina:
- Medie Mobili Esponenziali (EMA 50 & EMA 200)
- Bande di Bollinger (Superiore / Centrale / Inferiore)
Componenti dell'indicatore
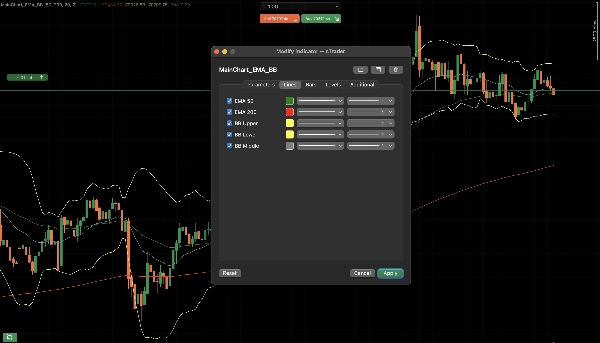
Medie Mobili Esponenziali (EMA)
Sono disponibili due EMA:
EMAPeriodo predefinitoColore predefinito
EMA 50
50
Verde
EMA 200
200
Rosso
Scopo:
- Direzione del trend
- Supporto/resistenza dinamici
- EMA 50 sopra EMA 200 → bias rialzista
- EMA 50 sotto EMA 200 → bias ribassista
Bande di Bollinger
Le Bande di Bollinger consistono in:
- Banda Superiore
- Banda Centrale (basata su EMA)
- Banda Inferiore
Impostazioni predefinite:
- Periodo: 20
- Deviazione Standard: 2.0
- Tipo di MA: Esponenziale
Scopo:
- Misurazione della volatilità
- Zone di ipercomprato / ipervenduto
- Prezzo che tocca la banda superiore → possibile esaurimento
- Prezzo che tocca la banda inferiore → possibile rimbalzo
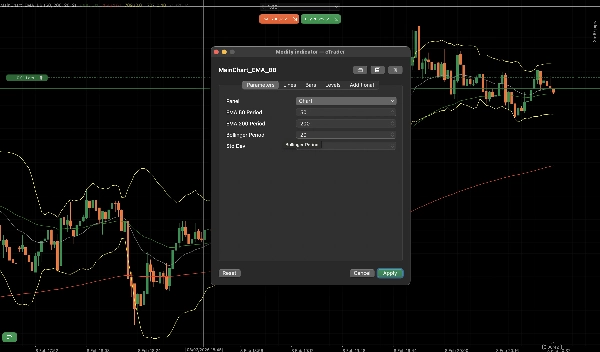
Parametri spiegati
Parametri EMA
- Mostra EMA 50: Abilita/disabilita EMA 50
- Periodo EMA 50: Periodo di calcolo
- Mostra EMA 200: Abilita/disabilita EMA 200
- Periodo EMA 200: Periodo di calcolo
Parametri Bande di Bollinger
- Mostra Bande di Bollinger: Abilita/disabilita BB
- Periodo BB: Periodo di riferimento
- Deviazione Std BB: Moltiplicatore di volatilità
Uso tipico nel trading
Conferma del trend
- EMA 50 sopra EMA 200
- Preferire solo operazioni long
Inversione / Ritracciamento
- Il prezzo ritraccia verso EMA 50
- Compressione e poi espansione della Banda di Bollinger
Il vantaggio di questo indicatore è che è configurabile e non c'è bisogno di impostare più indicatori.
Riepilogo
Profilo indicatore
Recensioni dei clienti
4.5
Recensioni: 2
5 | 50 % | |
4 | 50 % | |
3 | 0 % | |
2 | 0 % | |
1 | 0 % |
Recensioni dei clienti
February 16, 2026
a 1R exit plan makes review easier, and messy areas become easier to avoid.
February 15, 2026
Discussioni
Domande frequenti
Prop
Forex
Indices
Commodities
Crypto
Stocks
Bollinger
I prodotti disponibili tramite cTrader Store, inclusi bot di trading, indicatori e plugin, sono forniti da sviluppatori terzi e resi disponibili esclusivamente a scopo informativo e di accesso tecnico. cTrader Store non è un broker e non fornisce consulenze in materia di investimento, raccomandazioni individualizzate o garanzie di risultati futuri.
Altro da questo autore


Prezzo
Da 01/04/2025