
Descrizione
Pulse Radar: Analisi Professionale del Momentum e della Dinamica dei Cicli
L'indicatore Pulse Radar è una suite analitica avanzata per piattaforme basate su C#, progettata per decodificare la volatilità del mercato e identificare le fasi di sviluppo del prezzo ad alta probabilità. A differenza degli indicatori tradizionali ritardati, Pulse Radar impiega una valutazione adattativa delle zone di equilibrio del prezzo, fornendo una mappa strutturale chiara del mercato.
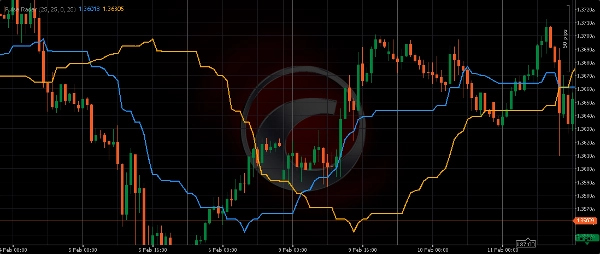
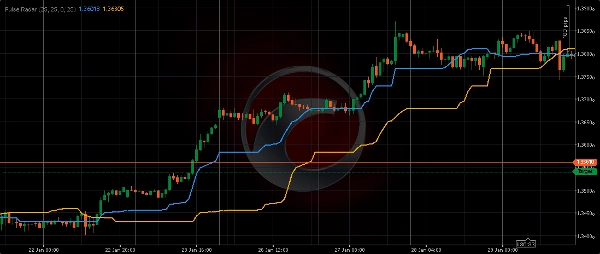
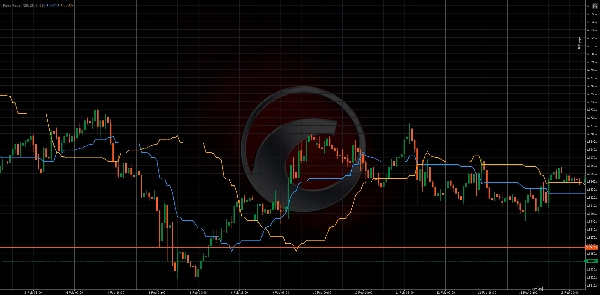
Il sistema costruisce due curve analitiche proprietarie:
- Vettore Attivo (Veloce): Una linea ad alta reattività che riflette il momentum immediato e i cambiamenti di liquidità a breve termine.
- Vettore Strategico (Lento): Una curva smussata che rappresenta il ciclo di mercato dominante e l'equilibrio del prezzo istituzionale.
Analizzando la posizione del prezzo rispetto a queste curve, i trader possono individuare con precisione la fase attuale del mercato all'interno di una gerarchia ciclica più ampia. Pulse Radar presenta inoltre un avanzato allineamento storico, che consente un confronto diretto tra i movimenti strutturali attuali e i modelli comportamentali passati.
Metodologia Tecnica
- Analisi dei Punti Estremi: Le linee sono calcolate basandosi sugli estremi grezzi del prezzo all'interno di finestre temporali specifiche, eliminando il rumore presente nelle medie mobili standard.
- Sincronizzazione di Fase: L'algoritmo supporta regolazioni manuali e automatiche dello sfasamento per allineare i dati con segmenti storici del grafico.
- Interazione Strutturale: La convergenza e divergenza dei vettori Attivo e Strategico evidenziano le transizioni tra le fasi di accumulo e distribuzione del trend.
Vantaggi Chiave
- Precisione senza Smussatura: I calcoli utilizzano dati di mercato grezzi, garantendo l'assenza di ritardi artificiali.
- Struttura Adattativa: Parametri completamente configurabili per adattarsi al profilo di volatilità specifico di qualsiasi asset.
- Utilità Cross-Mercato: Ottimizzato per Forex ad Alta Frequenza, Azioni USA, Commodities e Cripto.
- Architettura ad Alte Prestazioni: La logica leggera in C# garantisce zero impatto sulla stabilità della piattaforma durante periodi di alta volatilità.
Parametri di Input
- Periodo di Raggio d'Azione (Veloce/Lento): Definisce la profondità dei dati di mercato utilizzati per calcolare i vettori di momentum.
- Sfasamento di Fase (Veloce/Lento): Consente una calibrazione precisa delle linee analitiche rispetto alle strutture di prezzo storiche.
Riepilogo
The indicator employs extreme-point analysis on raw price extremes within defined look-back periods, avoiding the lag and noise typical of standard moving averages. It supports manual and automatic phase shift adjustments to align current data with historical price patterns, enhancing structural interaction insights through the convergence and divergence of its vectors. Pulse Radar operates with zero smoothing, ensuring calculations are based on raw market data for precision without artificial lag.
Input parameters include Reach Period and Phase Shift for both fast and slow vectors, allowing customization to fit specific asset volatility profiles. Its lightweight C# architecture is optimized for high-frequency trading environments, maintaining platform stability during volatile conditions. Pulse Radar is applicable to a wide range of symbols such as BTCUSD, EURUSD, GBPUSD, XAUUSD, and indices like NAS100.
Recensioni dei clienti
5 | 100 % | |
4 | 0 % | |
3 | 0 % | |
2 | 0 % | |
1 | 0 % |


