
คำอธิบาย
Price Magnet: ความหนาแน่นของราคาและระดับสถาบันขั้นสูง
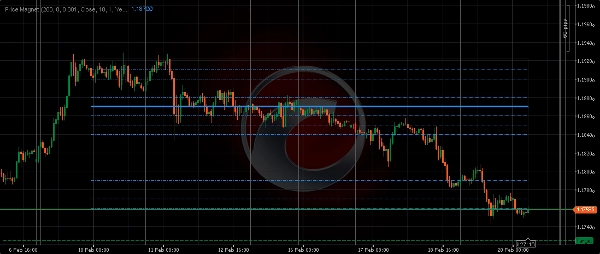
Price Magnet เป็นเครื่องมือวิเคราะห์ระดับมืออาชีพสำหรับ cTrader ที่ออกแบบมาเพื่อเปิดเผยจุดที่ "Smart Money" สะสมตำแหน่ง แตกต่างจากออสซิลเลเตอร์มาตรฐานหรืออินดิเคเตอร์แนวโน้ม Price Magnet ใช้วิธีทางคณิตศาสตร์เพื่อระบุโซนที่มีความสนใจสูงสุดในตลาดโดยการคำนวณ ความหนาแน่นของราคา.
วิธีการทำงาน
ตลาดมักจะกลับไปยังระดับที่ใช้เวลามากที่สุด นี่คือ "แม่เหล็ก" ตัวบ่งชี้นี้สแกนความลึกทางประวัติศาสตร์เฉพาะ จัดกลุ่มการเคลื่อนไหวของราคาเป็นกลุ่มความถี่ และเน้นระดับที่แข็งแกร่งที่สุดซึ่งมีแนวโน้มที่จะทำหน้าที่เป็นแม่เหล็กสำหรับราคาต่อไปในอนาคต
คู่มือพารามิเตอร์โดยละเอียด
เพื่อให้ได้ประโยชน์สูงสุดจาก Price Magnet จำเป็นต้องเข้าใจการตั้งค่าของมัน:
- ความลึกของการวิเคราะห์ (แท่งเทียน): กำหนดจำนวนแท่งเทียนในอดีตที่ตัวบ่งชี้วิเคราะห์
-
- ระยะสั้น (50-100): เหมาะสำหรับการสเกลปิ้งและการเทรดรายวัน
- ระยะยาว (300-500): เหมาะสำหรับการระบุโซน "S&R" สถาบันหลัก
- การเลื่อนย้อนหลัง: ช่วยให้คุณเลื่อนหน้าต่างการวิเคราะห์กลับไปในอดีต มีประโยชน์สำหรับการทดสอบย้อนหลังว่าโซนความหนาแน่นในอดีตมีผลต่อการเคลื่อนไหวของราคาต่อไปอย่างไร
- ขั้นตอนการจัดกลุ่ม (ราคา): การตั้งค่าที่สำคัญที่สุด กำหนด "ความไว" ของแม่เหล็ก
- แหล่งที่มาของราคา: เลือกส่วนของแท่งเทียนที่จะวิเคราะห์
-
- ปิด: การวิเคราะห์มาตรฐาน
- ค่ากลาง / ปกติ: มักแม่นยำกว่าเพราะคำนึงถึงช่วงทั้งหมดของแท่งเทียน
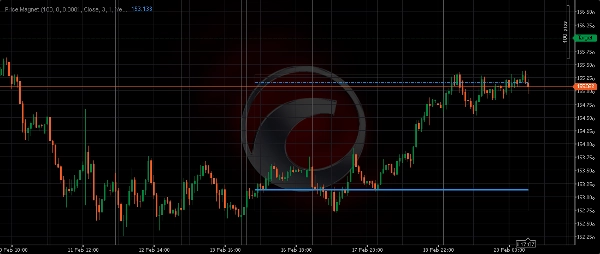
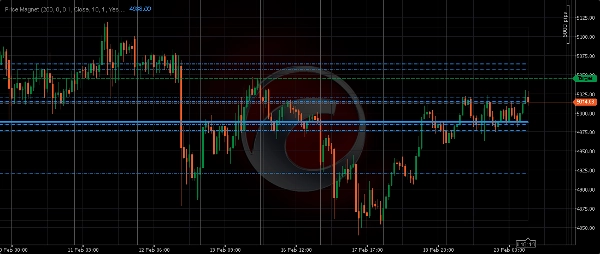
- ระดับที่จะแสดง: กำหนดจำนวนระดับแม่เหล็กที่จะวาด (ตั้งแต่ 1 ถึง 10) ระดับที่เกิดบ่อยที่สุดจะถูกวาดด้วยเส้นที่หนากว่าเสมอ
- การตั้งค่าภาพ (แสดงโซน/เส้นความหนาแน่น): สลับสี่เหลี่ยมพื้นหลัง (โซน) และเส้นแนวนอน โซนแสดงขอบเขตทั้งหมดของการเคลื่อนไหวราคาที่วิเคราะห์ ให้ภาพที่ชัดเจนของช่วงการซื้อขายปัจจุบัน
เคล็ดลับกลยุทธ์การเทรด
- การกลับสู่ค่าเฉลี่ย: เมื่อราคาห่างจาก "เส้นแม่เหล็กหลัก" อย่างมาก ให้มองหาสัญญาณความเหนื่อยล้าเพื่อเทรดการกลับสู่แม่เหล็ก
- การยืนยันการเบรคเอาท์: หากราคาทะลุผ่านระดับแม่เหล็กที่แข็งแกร่งและทดสอบซ้ำ ระดับนั้นมักจะเปลี่ยนจากแนวต้านเป็นแนวรับ
- เป้าหมายทำกำไร: ใช้ระดับแม่เหล็กรองเป็นเป้าหมายวัตถุประสงค์สำหรับการเทรดของคุณ
Price Magnet สรุปข้อมูลโปรไฟล์ตลาดที่ซับซ้อนเป็นระดับภาพที่ใช้งานได้จริง มอบความได้เปรียบระดับมืออาชีพในทุกสภาวะตลาด
สรุป
รีวิวจากลูกค้า
5 | 50 % | |
4 | 25 % | |
3 | 25 % | |
2 | 0 % | |
1 | 0 % |


