
Descripción
HiLo Marker: Descubre los puntos clave de giro del mercado
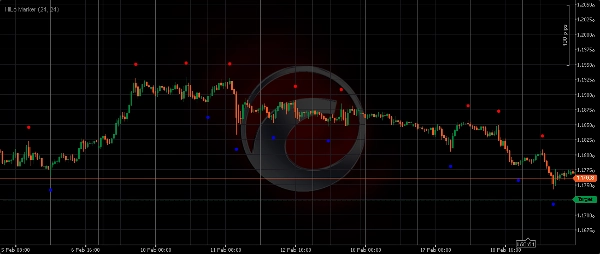
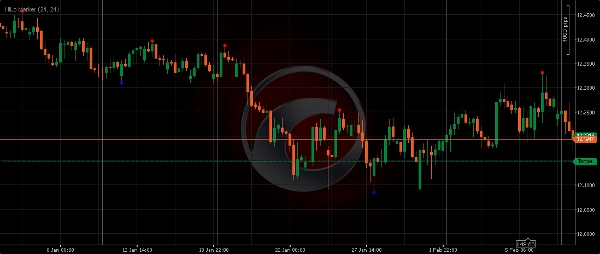
HiLo Marker es un indicador intuitivo y esencial de cTrader diseñado para detectar y resaltar automáticamente los máximos y mínimos significativos de precios basados en una ventana histórica definida. Esta herramienta aporta claridad a tus gráficos al eliminar las conjeturas al identificar puntos de giro, ofreciendo una ventaja visual para cualquier operador de acción del precio.
Cómo funciona
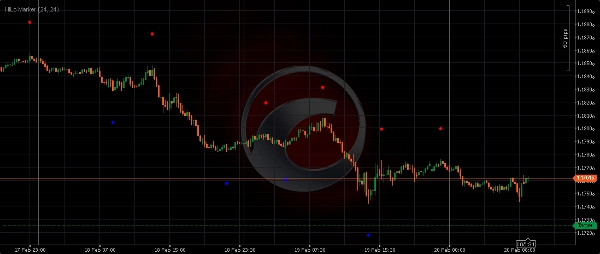
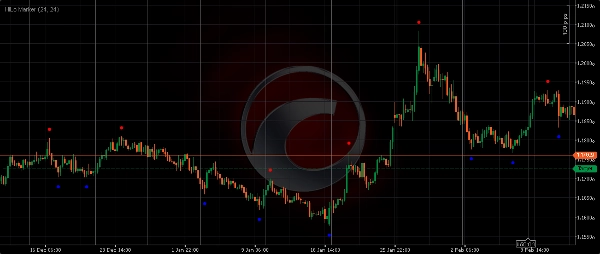
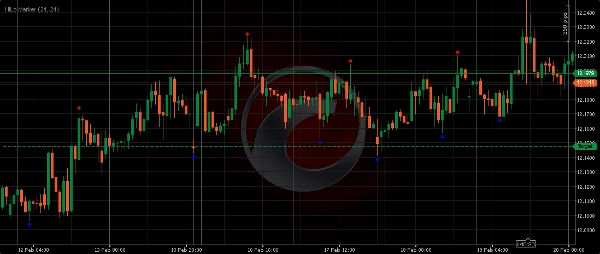
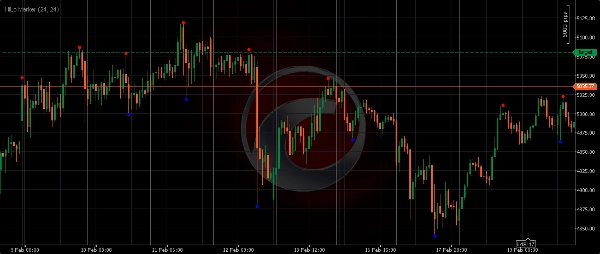
El indicador escanea una "Ventana de Distancia" especificada (número de barras) para encontrar el máximo absoluto más alto y el mínimo más bajo dentro de ese rango. Una vez que una barra se confirma como el pico o valle de su ventana circundante, HiLo Marker coloca un punto (o flecha) rojo o azul distintivo encima/debajo de esa vela. Este método te ayuda a identificar objetivamente niveles cruciales donde el precio previamente revirtió o encontró un fuerte impulso.
Características y beneficios clave
- Precisión automatizada: No más dibujar líneas manualmente. HiLo Marker identifica objetivamente puntos críticos de giro.
- Estructura clara del mercado: Visualiza al instante oscilaciones, tendencias y rangos, haciendo el análisis de gráficos más eficiente.
- Zonas de soporte y resistencia: Los máximos y mínimos marcados frecuentemente actúan como soporte y resistencia futuros, ofreciendo puntos de entrada/salida de alta probabilidad.
- Versátil: Funciona perfectamente en todos los instrumentos financieros (Forex, Oro, Índices, Cripto, Acciones) y en cualquier marco temporal.
- Visuales personalizables: Ajusta los colores del marcador y la distancia de desplazamiento para una integración perfecta en el gráfico.
Parámetros de entrada explicados:
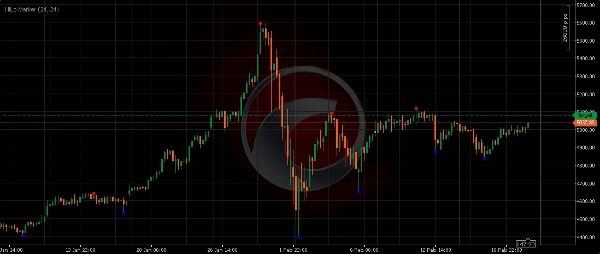
- Longitud (Desplazamiento): Este valor determina qué tan lejos por encima del máximo o por debajo del mínimo se colocará el marcador. Un valor mayor crea una separación visual más amplia de la vela.
-
- Ejemplo:
Length = 24significa que el marcador aparecerá a 24 pips (o ticks, dependiendo del símbolo) de distancia del máximo/mínimo real.
- Ejemplo:
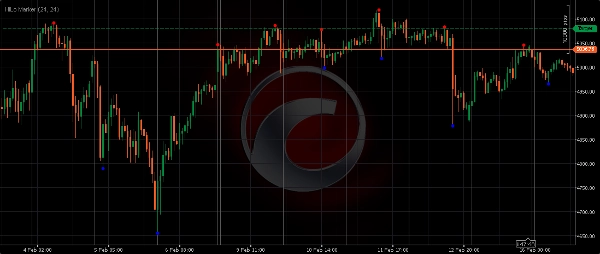
- Ventana de distancia: Este es el período de retroceso que el indicador usa para identificar un máximo o mínimo. Una barra solo se marca como Hi/Lo si es el máximo/mínimo absoluto dentro de este número especificado de barras circundantes.
-
- Dist
más pequeño(p. ej., 10-20): Captura oscilaciones menores y ruido de mercado a corto plazo (adecuado para scalping). - Dist
más grande(p. ej., 30-60+): Identifica oscilaciones más significativas, a nivel institucional y grandes reversiones de tendencia (ideal para swing trading o marcos temporales mayores).
- Dist
Mejora tu trading de acción del precio con HiLo Marker. Obtén una perspectiva más clara de la dinámica del mercado y toma decisiones más informadas. ¡Descárgalo ahora!
Resumen
Valoraciones de clientes
5 | 0 % | |
4 | 100 % | |
3 | 0 % | |
2 | 0 % | |
1 | 0 % |


