
SMC
Indicatore
179 download
Versione 1.0, Feb 2026
Windows, Mac
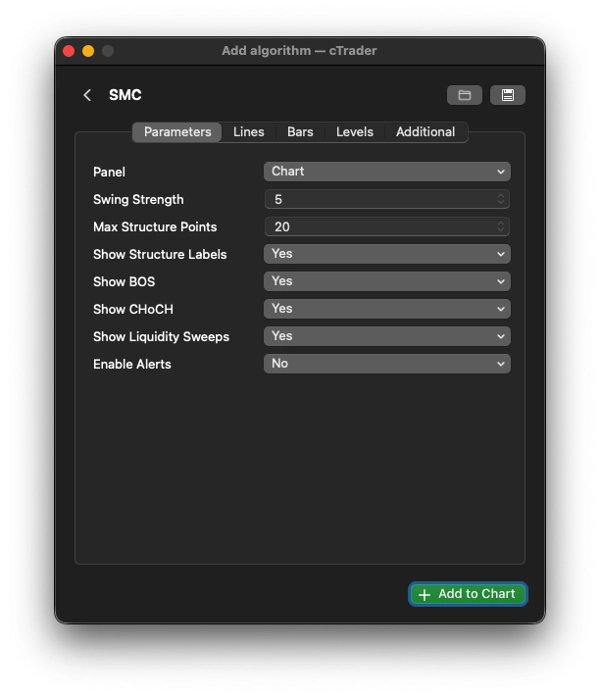
Riepilogo della logica principale – come decide cosa è cosa
- Rileva i swing usando la logica classica dei frattali (barre SwingStrength a sinistra + destra)
-
- Predefinito = 5 → swing ragionevolmente puliti sulla maggior parte dei timeframe
- Determina il trend dai ultimi due massimi + ultimi due minimi:
-
- HH + HL → trend rialzista
- LH + LL → trend ribassista
- Rilevamento BOS / CHoCH (alla chiusura):
-
- Chiusura > massimo swing precedente
-
- Se il trend era rialzista → BOS (continuazione)
- Se il trend era ribassista → CHoCH (potenziale inversione)
- Chiusura < minimo swing precedente → logica opposta
- Sweep di liquidità (pattern SMC molto comune):
-
- Ombra alta sopra l'ultimo massimo swing ma chiusura sotto di esso → sweep rialzista (probabile falso breakout verso l'alto)
- Ombra bassa sotto l'ultimo minimo swing ma chiusura sopra di esso → sweep ribassista
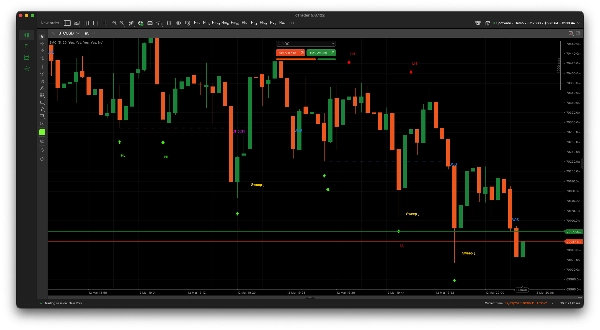
Uso tipico del trading SMC di un indicatore del genere
- Cerca CHoCH + sweep di liquidità nella direzione opposta → setup di inversione precoce
- Operare nella direzione di BOS dopo un pullback / sweep
- Evitare di operare contro la struttura mostrata dalle etichette HH/HL vs LH/LL
- Molti trader aspettano sweep → sequenze di conferma CHoCH/BOS
Profilo indicatore
0.0
Recensioni: 0
Recensioni dei clienti
Questo prodotto non ha ancora ricevuto recensioni. L'hai già provato? Fallo sapere agli altri per primo!
BTCUSD
Forex
Breakout
Indices
EURUSD
Commodities
GBPUSD
NZDUSD
RSI
Prop
ZigZag
Scalping
Fair Value Gap
SMC
Crypto
Stocks
XAUUSD
NAS100
USDJPY
I prodotti disponibili tramite cTrader Store, inclusi bot di trading, indicatori e plugin, sono forniti da sviluppatori terzi e resi disponibili esclusivamente a scopo informativo e di accesso tecnico. cTrader Store non è un broker e non fornisce consulenze in materia di investimento, raccomandazioni individualizzate o garanzie di risultati futuri.
Altro da questo autore


![Logo di "[Stellar Strategies] BOS Trend 1.0"](https://cdn.ctrader.com/image/webp/6cdec0f1-0e97-4a82-a8a4-2b67aed54d38_25695)
![Logo di "[Hamster-Coder] Moving Average MTF"](https://cdn.ctrader.com/image/webp/b11b98b1-194d-4b8e-b00e-d611826ad159_31226)


Da 01/12/2025
179
Installazioni gratuite