
Descrizione
TeoriaCutrim è un indicatore sovrapposto statistico progettato per quantificare il comportamento recente del mercato attraverso la distribuzione delle candele e l'analisi della volatilità. Invece di prevedere la direzione, fornisce dati oggettivi su ciò che il mercato ha appena fatto all'interno di una finestra configurabile di candele.
Dati di Mercato Analizzati
L'indicatore valuta un numero definito dall'utente di candele recenti (periodo di Lookback) ed estrae:
- Numero e percentuale di candele rialziste (close > open)
- Numero e percentuale di candele ribassiste (close < open)
- Differenza tra dominanza rialzista e ribassista
- Intervallo medio della candela (in pips)
- Intervallo della candela corrente (in pips)
- Intervallo totale del prezzo nella finestra analizzata
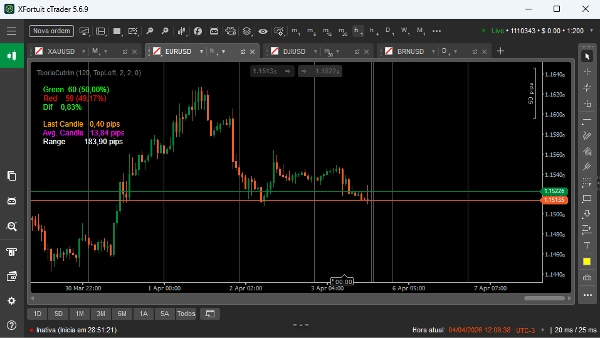
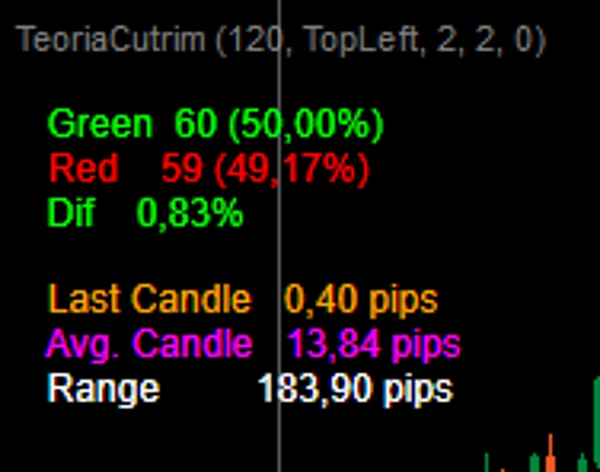
Output Visivo e Interpretazione
L'indicatore mostra le metriche chiave direttamente sul grafico:
- Verde: totale candele rialziste e percentuale
- Rosso: totale candele ribassiste e percentuale
- Dif: differenza assoluta tra percentuali rialziste e ribassiste
- Ultima Candela: dimensione corrente della candela in pips
- Candela Media: dimensione media delle candele nella finestra selezionata
- Intervallo: distanza tra il massimo più alto e il minimo più basso nella finestra
L'interpretazione è semplice:
- Un numero maggiore di candele rialziste suggerisce una pressione al rialzo recente
- Un numero maggiore di candele ribassiste suggerisce una pressione al ribasso recente
- Una bassa differenza (Dif) indica equilibrio o casualità
- L'aumento della dimensione media delle candele indica una volatilità in espansione
- Un ampio intervallo totale suggerisce un'espansione del mercato, mentre un intervallo piccolo suggerisce compressione
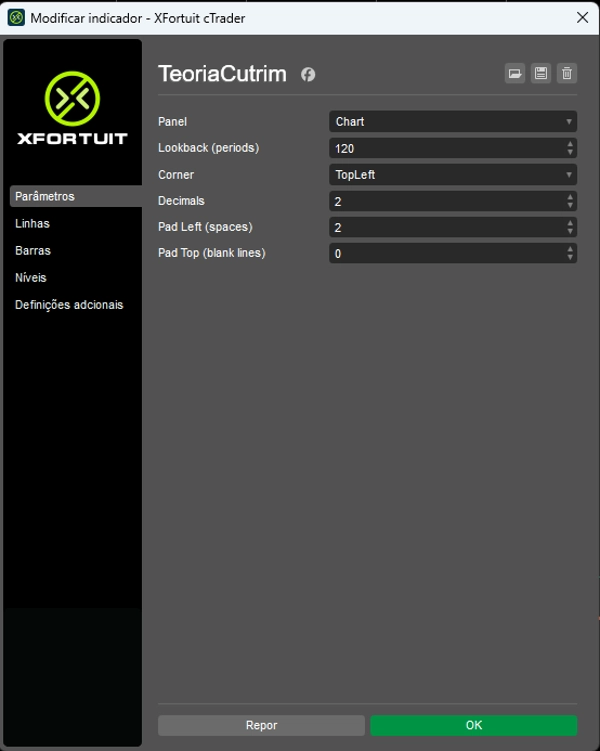
Parametri Chiave
- Lookback: numero di candele usate per l'analisi (completamente regolabile)
- Angolo: posizione sullo schermo della visualizzazione dei dati
- Decimali: numero di cifre decimali mostrate
- Pad Sinistro / Pad Superiore: regolazioni di spaziatura visiva
Casi d'Uso
TeoriaCutrim è meglio utilizzato come strumento di contesto, non come generatore di segnali. Le applicazioni tipiche includono:
- Misurare lo squilibrio statistico prima di entrare nelle operazioni
- Identificare l'espansione o la contrazione della volatilità
- Filtrare le operazioni basate sul comportamento recente delle candele
- Supportare strategie quantitative o basate sulla probabilità
Utente Target
Questo indicatore è progettato per trader che si affidano a dati, statistiche e analisi oggettive piuttosto che al riconoscimento soggettivo di pattern. Adatto sia per trader discrezionali che sistematici.


![Logo di "[Stellar Strategies] Market Session Ultimate"](https://cdn.ctrader.com/image/webp/61ffd537-0125-4246-9e72-42eca1791d64_28232)


