present
Registrati e ricevi uno sconto da $50 sul tuo primo acquisto
Trading product for AW Multi Data Indicatore, image 1
AW Multi Data
5.62K
Installazioni gratuite

Descrizione

Riepilogo

Riepilogo AI
AW Multi Data is a trading indicator that displays key trading metrics directly on your chart. It shows the current symbol and timeframe, daily net profit percentage, daily net profit amount, and spread. The indicator requires the timezone to be set to UTC to accurately reflect daily profit values. This tool provides real-time performance data to assist traders in monitoring their trades within the charting interface.
Profilo indicatore

Discussioni

Recensioni dei clienti

0.0
Recensioni: 0
Recensioni dei clienti
Questo prodotto non ha ancora ricevuto recensioni. L'hai già provato? Fallo sapere agli altri per primo!

Domande frequenti

I prodotti disponibili tramite cTrader Store, inclusi bot di trading, indicatori e plugin, sono forniti da sviluppatori terzi e resi disponibili esclusivamente a scopo informativo e di accesso tecnico. cTrader Store non è un broker e non fornisce consulenze in materia di investimento, raccomandazioni individualizzate o garanzie di risultati futuri.

Altro da questo autore

with this indicator you could see other time frame candle in your chart.
show spread on chart
some user add moving average to macd to see better. in ctrader 4.3.11 there is a problem with this . I make a macd tha
this indicator show macd on chart.
Multi Time Frame Moving Average is a powerful and flexible indicator for cTrader
 this moving include everything that a trader needs from Moving Average.
this indicaotr show distance between Tenkan to Kijun, Close to Kijun and Close to Tenkan 
Add Slowing to IR Moving Average.
IR Candle Open plots customizable opening price lines for daily, weekly, and monthly candles
Coral indicator
you could put your check list in your chart you could split your test with “,” you could put your checklist in indicat
this indicator show other time frame close in lower time frame. for ex: show daily close in m 15.

Potrebbe interessarti anche

Strong Supertrend Turn Market Movement into a Clear Map Market analysis
The QQE enhances the RSI by incorporating moving averages. This version includes fast and slow trailing levels.
Delta Peak Bubbles is a tick‑chart overlay for cTrader that highlights the strongest momentum spikes.
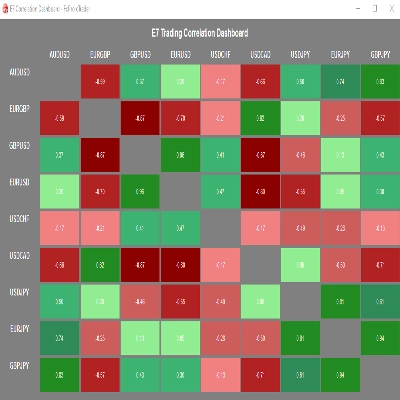
E7 Correlation Dashboard.
Multi-symbol multi-timeframe SuperTrend panel with watchlist, one-click jump, and alerts.
Smart Money Concepts (SMC) indicator with real-time Fair Value Gap (FVG) boxes, $50 round numbers, and live market HUD.
Stop trading with tunnel vision! 🚫 The Heat Map Dashboard is an institutional-grade visual trading assistant
A precision overlay tool that combines session-aware VWAP logic and standard deviations.
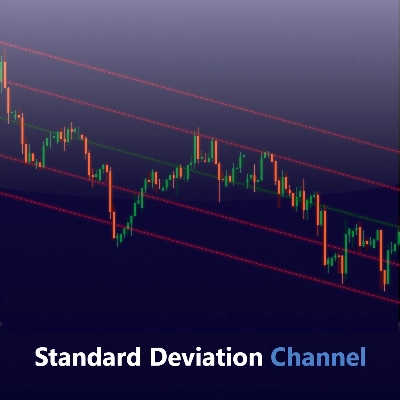
Visualize trends with Standard Deviation Channel! Display median, and add customizable upper/lower deviation channels.
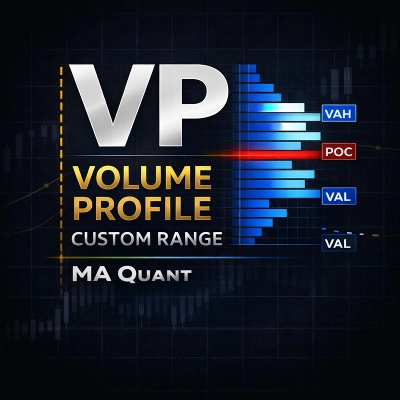
The MA Quant Volume Profile Custom Range is a trading indicator that analyzes volume distribution across the price.
View tick activity across a selected chart range with Point of Control, Value Area High and Value Area Low.
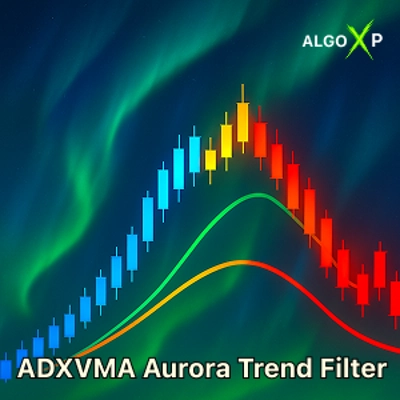
⚡ ADXVMA Aurora Trend Filter combines ADX trend strength with an adaptive EMA blend ⚡
Average Cost Price helps you keep track of your open positions on the chart. In doing so, it provides lines and explanat
Hybrid adaptive trend filter with clean Buy/Sell signals, dynamic bands and zero-repaint analysis.
GOLD SENTINEL v1.0 - A CANDLE-COLORING INDICATOR FOR GOLD.
🚀 TMAX RBA Indicator - The Ultimate Multi-Timeframe Momentum System 🚀
Angora Pattern Recognition is a cTrader indicator that finds, draws and tracks classic chart patterns automatically.
Half Trend Cloud

Prezzo

5.62K
Installazioni gratuite