present
Registrieren Sie sich und erhalten Sie $50 Rabatt auf Ihren ersten Kauf
Trading product for PGS - Pareto Gaussian Skew by Zofesu Indikator EMA Supertrend, image 1
PGS - Pareto Gaussian Skew by Zofesu
Indikator
Version 1.0, May 2026
Windows, Mac
Trading product for PGS - Pareto Gaussian Skew by Zofesu Indikator EMA Supertrend, image 2
Trading product for PGS - Pareto Gaussian Skew by Zofesu Indikator EMA Supertrend, image 3
Trading product for PGS - Pareto Gaussian Skew by Zofesu Indikator EMA Supertrend, image 4
Trading product for PGS - Pareto Gaussian Skew by Zofesu Indikator EMA Supertrend, image 5
Trading product for PGS - Pareto Gaussian Skew by Zofesu Indikator EMA Supertrend, image 6
Seit 01/12/2025
280
Kostenlose Installationen

Beschreibung

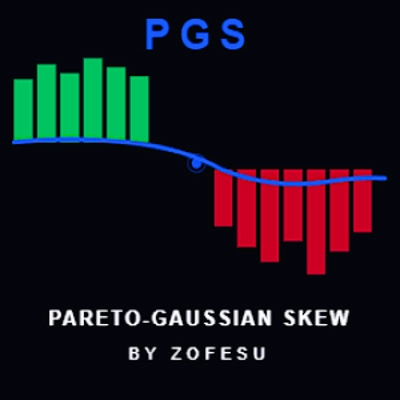
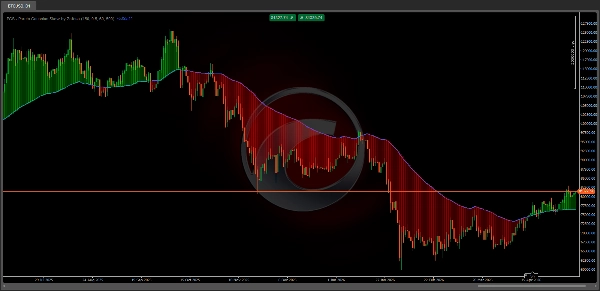
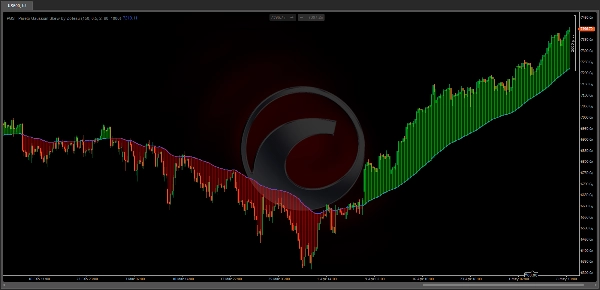
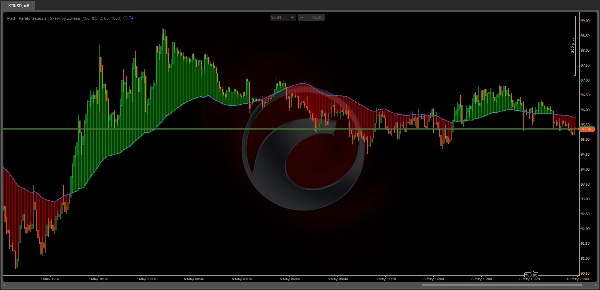
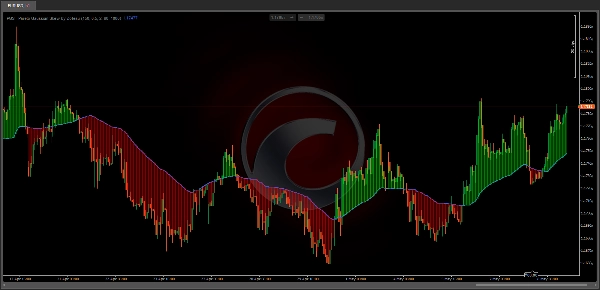
📊 PGS — Pareto-Gaussian Skew by Zofesu — Institutional Gravity Line & Tension Cloud. PGS is a precision overlay indicator built on two mathematical principles: the Gaussian distribution and the Pareto 80/20 rule. It identifies the invisible gravitational center of price — filtering out noise and focusing only on the 20% of moves that drive 80% of the trend.

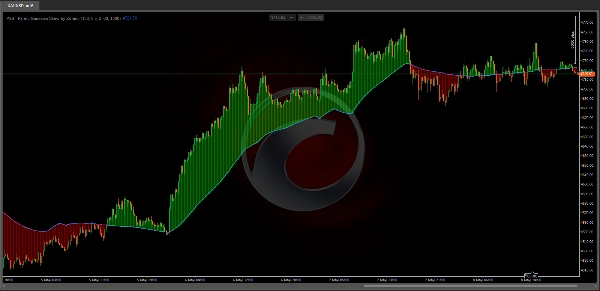
⚙ HOW IT WORKS The indicator calculates a dynamic baseline (SMA) and standard deviation over a configurable lookback window. Only price moves that exceed one standard deviation are considered statistically significant — these represent institutional displacement, not random noise. The Pareto Skew Factor amplifies these extreme moves and feeds them into an EMA smoother, producing a stable gravity line that adapts to market structure. The Tension Cloud fills the space between price and the gravity line: Green cloud (price > PGS line) — price is above gravity, bullish bias Red cloud (price < PGS line) — price is below gravity, bearish bias The wider the cloud, the more extended price is from its statistical center — a potential reversion zone.

🔑 KEY FEATURES
✅ Pareto-Gaussian gravity line — filters noise, reacts only to institutional moves
✅ Dynamic Tension Cloud — visualizes distance between price and gravity center
✅ Configurable Skew Factor — control sensitivity to extreme price displacement
✅ Adjustable lookback (Smith's Memory) — 20 to 500 bars
✅ Custom cloud colors and opacity — full visual control
✅ Max Cloud Bars limit — performance-optimized rendering
✅ Lightweight C# — no performance impact

📚 HOW TO USE

  1. Add PGS to any chart and timeframe
  2. Watch the PGS blue line — this is your gravity center
  3. Green cloud = price above gravity → look for long setups or trend continuation
  4. Red cloud = price below gravity → look for short setups or trend continuation
  5. Wide cloud = price is extended → potential mean reversion zone, reduce position size or wait
  6. Price crossing the PGS line = gravity shift → potential trend change
  7. Use in confluence with S/R levels, VWAP, or volume signals

Works on any TimeFrame and Asset: Indices (NAS100, SPX500), Forex, Gold, Crypto

🔗 PARAMETERS

  • Smith's Memory (Lookback) — statistical window for SMA and StdDev calculation (default 150, range 20–500)
  • Pareto Skew Factor — weight of extreme moves in gravity calculation (default 0.5, range 0.1–1.0)
  • PGS line thickness can be adjusted via right-click → Format on the indicator or Properties → lines (default 2)
  • Cloud Opacity (0–200) — transparency of the Tension Cloud (default 60, 0=Off)
  • Max Cloud Bars — maximum number of bars rendered for the cloud (default 500)
  • Bull Cloud Color — color when price is above gravity (default green)
  • Bear Cloud Color — color when price is below gravity (default red)

📝 NOTES

  • Higher Skew Factor (0.8–1.0) = gravity line reacts more aggressively to institutional moves
  • Lower Skew Factor (0.1–0.3) = smoother, more conservative gravity line
  • Higher Lookback = slower, macro-level gravity center
  • Lower Lookback = faster, more reactive to recent price action
  • Max Cloud Bars upper limit is 2000. Values above 1000 may impact performance. On lower timeframes (M5 and below) use 300 or less.

⚠️ DISCLAIMER Trading financial instruments involves substantial risk of loss. Past performance of any indicator or strategy does not guarantee future results. This tool is provided for informational and educational purposes only. Always use proper risk management and never risk more than you can afford to lose. The author is not responsible for any trading losses incurred through the use of this indicator.

Zusammenfassung

Indikatorprofil
Indikatorkategorie
Marktstruktur (SMC)
Ausgabetyp
Visualisierung
Datenanforderungen
Nur Balken
Unterstützte Signale
Trendstärke
Level – Berührung
Level – Durchbrechen
Wendepunkt

Diskussion

Kundenbewertungen

0.0
Bewertungen: 0
Kundenbewertungen
Bisher gibt es keine Bewertungen für dieses Produkt. Haben Sie es schon ausprobiert? Dann können Sie die erste Person sein, die andere darüber informiert!

Häufig gestellte Fragen (FAQ)

EMA
Supertrend
Key Levels
MSS
Volume
Market Structure
VWAP
Über den cTrader Store verfügbare Produkte, einschließlich Handelsbots, Indikatoren und Plugins, werden von externen Entwicklern bereitgestellt und nur zu Informations- und technischen Zugriffszwecken verfügbar gemacht. cTrader Store ist kein Broker und erbringt keine Anlageberatung, persönlichen Empfehlungen oder eine Garantie für zukünftige Performance.

Mehr von diesem Autor

Indikator
VWAP
Forex
+7
VWAP + Swing Liquidity + SFP Signals — detects liquidity sweeps with color-coded alerts.
Indikator
SMC
Forex
+5
Fear & Greed engine — detects institutional overheating with BB + Percentile signals.

Das könnte Sie auch noch interessieren

Indikator
Key Levels
Drawdown Monitor
+1
[ANALYTICAL/INFORMATIONAL] Track NET positions, Break-Even & Drawdown. No order execution.
Indikator
EMA
SMA
+3
MACD indicator modeled after TradingView, featuring a 4-color momentum histogram, sound/pop-up crossover alerts.
Indikator
Doji
Wedge
+5
Angora Pattern Recognition is a cTrader indicator that finds, draws and tracks classic chart patterns automatically.
Indikator
Supertrend
Moving Average
Easy Trade: Trend & Breakout Indicator for cTrader
Indikator
SMC
Prop
+13
Institutional FVG detection with HTF projection, precise volume deltas, and smart fill logic.
Indikator
RSI
Forex
+10
INDICATOR,LIQUIDITY POOLS,ACCURATE SIGNAL, NO DELAY,80% PROBABILITY
Indikator
Forex
Stocks
+1
SmartSignal Pro: Precise BUY/SELL signals to profit in any market. Trade like a pro! 🚀
Indikator
Forex
BTCUSD
+5
INDICATOR,LIQUIDITY POOLS,ACCURATE SIGNAL, NO DELAY,80% PROBABILITY
Indikator
ZigZag
Indices
+2
Auto Trendlines, Fibonacci, Pitchfork and Patterns from non‑repainting pivots. One‑click Presets, targeted Alerts, and a
Indikator
BTCUSD
EURUSD
+6
🔮 Projects statistically probable future price paths using MC simulation and evaluates directional bias through a.....
Indikator
ATR
BOS
+5
Opening ranges, dynamic trend channels, and multi-scale breakout/retest analysis for clear intraday chart decisions.
Indikator
Prop
Forex
+5
Pivot Point with base zone daily Asia-London-New york Session.
Indikator
Imbalance
Key Levels
+5
Smart Money Concepts (SMC) indicator with real-time Fair Value Gap (FVG) boxes, $50 round numbers, and live market HUD.
Indikator
Breakout
Allow trader to visualize Support & Resistance across different timeframes,give trader an overview of the current market
Indikator
Master RSI reversals with Parabolic SAR precision! Get real-time alerts for high-probability trend changes.
Indikator
SmartFibonacci — automatic Fibonacci retracements & extensions with swing detection, alerts and clean labels for cTrader
Indikator
RSI
MACD
This indicator is a combination of MACD and RSI into one. This is perfect fusion and powerful indicator ever.
Indikator
ADX
ATR
+2
GOLD SENTINEL v1.0 - A CANDLE-COLORING INDICATOR FOR GOLD.

Preis

Seit 01/12/2025
280
Kostenlose Installationen