
Descrizione
SC Market Structure
SC Market Structure è un indicatore visivo della struttura di mercato progettato per identificare automaticamente e mostrare i massimi e minimi oscillanti più importanti direttamente sul grafico.
L'indicatore analizza continuamente l'azione del prezzo e mappa l'evoluzione della struttura di mercato collegando massimi e minimi significativi con linee di struttura dinamiche. Questo permette ai trader di riconoscere istantaneamente la direzione del trend, la continuazione del trend e i potenziali punti di inversione senza dover segnare manualmente le oscillazioni di mercato.
Inoltre, SC Market Structure classifica automaticamente ogni nuovo punto strutturale utilizzando le definizioni standard della struttura di mercato:
- HH (Higher High)
- HL (Higher Low)
- LH (Lower High)
- LL (Lower Low)
Combinando il rilevamento automatico delle oscillazioni con l'etichettatura in tempo reale della struttura di mercato, i trader possono comprendere rapidamente se il mercato è in trend, in consolidamento o mostra segni di una potenziale inversione di tendenza.
Caratteristiche principali
• Rilevamento automatico dei massimi e minimi oscillanti significativi
• Linee di struttura dinamiche che collegano i pivot di mercato
• Identificazione automatica dei Higher Highs (HH)
• Identificazione automatica dei Higher Lows (HL)
• Identificazione automatica dei Lower Highs (LH)
• Identificazione automatica dei Lower Lows (LL)
• Visualizzazione chiara della struttura di mercato rialzista e ribassista
• Riconoscimento immediato dei pattern di continuazione e inversione del trend
• Funziona su tutti i mercati e timeframe
• Presentazione del grafico pulita e intuitiva
Visualizzazione della struttura di mercato
SC Market Structure valuta continuamente le oscillazioni di prezzo ed etichetta ogni nuovo punto strutturale confermato.
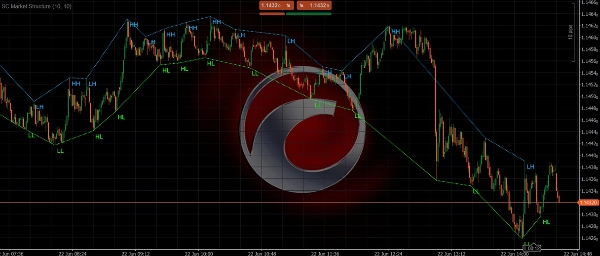
Struttura rialzista
Una struttura di mercato rialzista è identificata quando il prezzo forma:
• Higher Highs (HH)
• Higher Lows (HL)
Questa sequenza indica che gli acquirenti mantengono il controllo e il trend rialzista è ancora intatto.
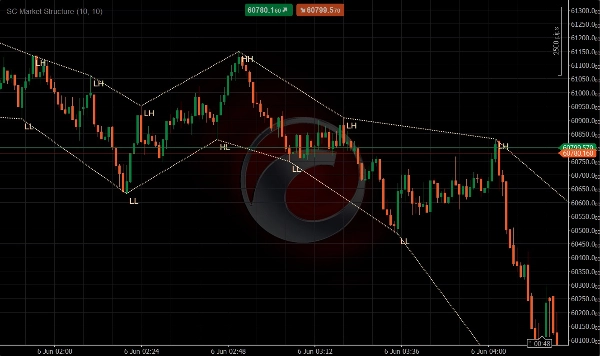
Struttura ribassista
Una struttura di mercato ribassista è identificata quando il prezzo forma:
• Lower Highs (LH)
• Lower Lows (LL)
Questa sequenza indica che i venditori mantengono il controllo e il trend ribassista è ancora intatto.
L'indicatore collega visivamente questi punti strutturali utilizzando linee di tendenza dinamiche, permettendo ai trader di seguire l'evoluzione della struttura dei prezzi in tempo reale.
Perché usare SC Market Structure
Comprendere la struttura di mercato è uno degli aspetti più importanti del trading basato sull'azione del prezzo.
Molti trader disegnano manualmente massimi, minimi e strutture di trend, il che può richiedere tempo ed essere soggettivo.
SC Market Structure automatizza questo processo identificando oggettivamente i pivot strutturali e etichettandoli secondo i principi professionali della struttura di mercato.
Questo permette ai trader di:
• Leggere più rapidamente la direzione del trend
• Identificare potenziali inversioni prima
• Confermare i setup di continuazione del trend
• Migliorare il timing di entrata e uscita
• Mantenere un grafico più pulito e organizzato
Perfetto per
• Trader di Price Action
• Scalper
• Day trader
• Swing trader
• Trader trend-following
• Trader di Market Structure
• Trader Smart Money Concept (SMC)
• Trader che cercano un'analisi strutturale oggettiva
Nota importante
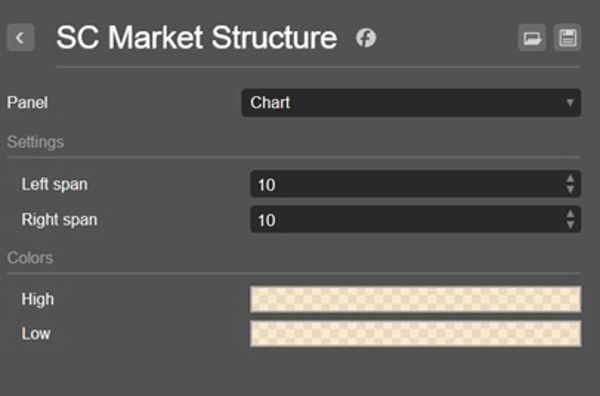
SC Market Structure identifica la struttura di mercato basandosi su massimi e minimi oscillanti confermati. Le etichette e le linee di struttura vengono generate solo dopo che un pivot è stato validato dalle impostazioni di calcolo selezionate.
Regolare le impostazioni di sensibilità influenzerà la frequenza con cui vengono identificati e mostrati nuovi punti strutturali.
A differenza dei tradizionali indicatori MACD, il suo concetto visivo è costruito attorno all'integrazione delle informazioni di momentum nell'analisi dell'azione del prezzo. Per questo motivo, non è consigliato utilizzare l'indicatore in un pannello separato e ciò non fornisce l'esperienza utente prevista.
Leggi il trend. Segui la struttura. Fai trading con fiducia.
Riepilogo
By continuously analyzing price action, SC Market Structure helps traders quickly determine trend direction, recognize trend continuation, and spot potential reversal points without manual chart annotations. It supports all markets and timeframes, providing a clean and intuitive chart presentation.
This tool is suited for price action traders, scalpers, day traders, swing traders, trend followers, and those using Smart Money Concepts or seeking objective market structure analysis. Sensitivity settings allow customization of pivot detection frequency. The indicator integrates momentum information into price action analysis and is designed for direct chart overlay rather than separate panels.
Recensioni dei clienti
5 | 100 % | |
4 | 0 % | |
3 | 0 % | |
2 | 0 % | |
1 | 0 % |


