
Descrizione
SC Supports & Resistances
Lo strumento professionale di supporto e resistenza che ogni trader dovrebbe avere
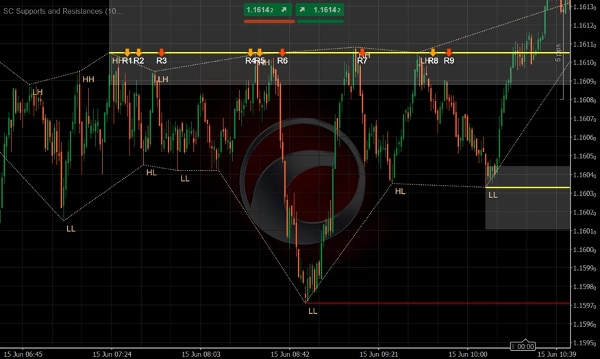
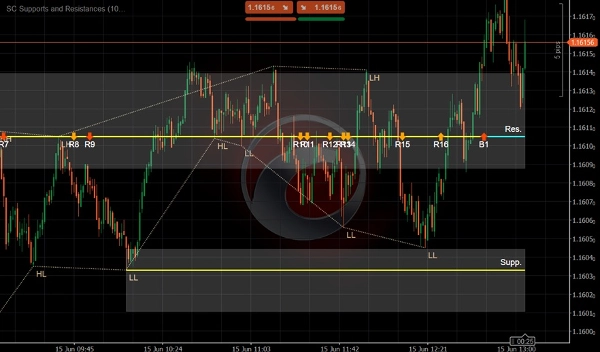
SC Supports & Resistances è un indicatore avanzato di price action progettato per identificare, gestire e visualizzare automaticamente zone dinamiche di supporto e resistenza direttamente sul grafico.
A differenza degli strumenti tradizionali di supporto e resistenza che si basano su semplici linee orizzontali, SC Supports & Resistances utilizza bande adattive basate su ATR per rappresentare aree realistiche di reazione del mercato, aiutando i trader a capire dove il prezzo è più probabile che venga respinto, consolidato o superato.
L'indicatore analizza continuamente le oscillazioni di mercato per rilevare livelli significativi di supporto e resistenza, monitora come il prezzo interagisce con ogni zona nel tempo e classifica automaticamente ogni reazione come Respingimento o Rottura. Le reazioni forti sono evidenziate separatamente, permettendo ai trader di distinguere immediatamente tra test minori e eventi di mercato significativi.
Combinando il rilevamento intelligente dei livelli, la gestione dinamica delle zone e l'analisi delle reazioni in tempo reale, SC Supports & Resistances trasforma il trading di supporto e resistenza in un processo oggettivo e misurabile.
Caratteristiche principali
✔ Rilevamento automatico di zone significative di supporto e resistenza
✔ Bande dinamiche basate su ATR che si adattano alla volatilità del mercato
✔ Identificazione automatica di Respingimenti e Rotture
✔ Rilevamento di Respingimenti Forti e Rotture Forti
✔ Monitoraggio in tempo reale della forza del livello e delle reazioni di mercato
✔ Riconoscimento intelligente dei livelli di swing basato sul comportamento del prezzo
✔ Scadenza automatica dei livelli obsoleti per mantenere i grafici puliti
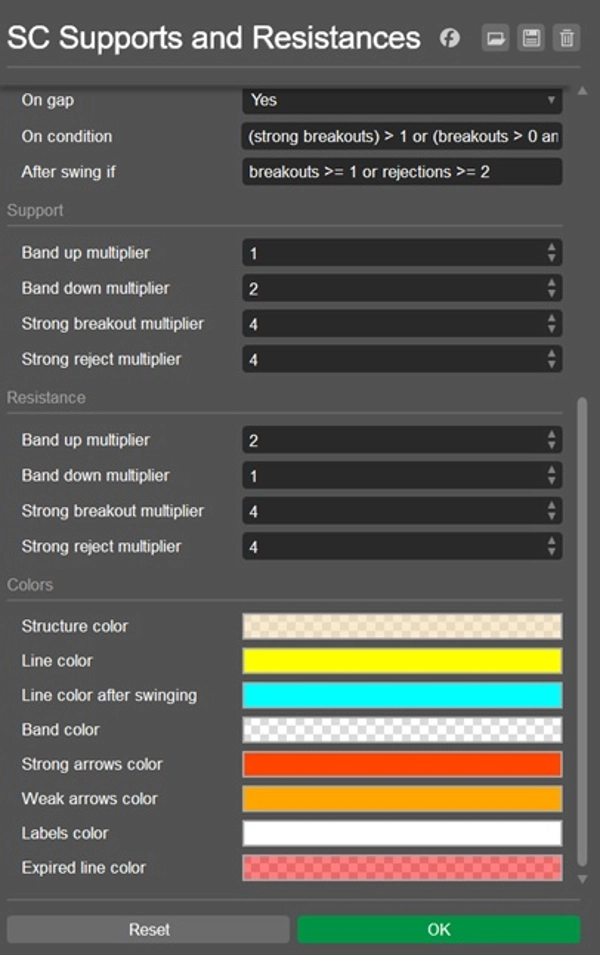
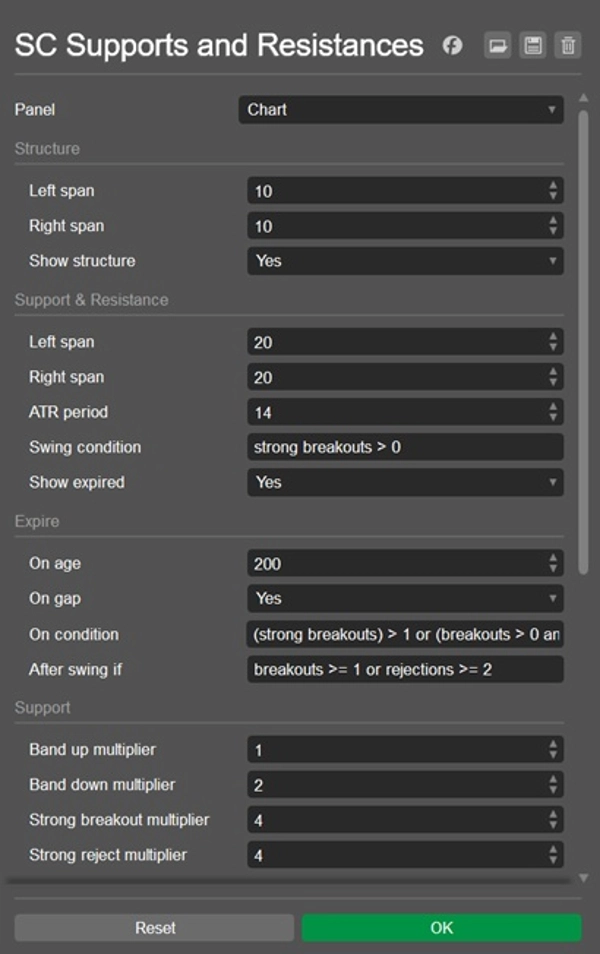
✔ Sensibilità e criteri di reazione completamente personalizzabili
✔ Rappresentazione visiva chiara con bande, frecce, etichette e statistiche
✔ Funziona su tutti i mercati e tutti i timeframe
Intelligenza avanzata dei livelli
SC Supports & Resistances fa molto più che semplicemente tracciare livelli.
Ogni zona rilevata si evolve in base a come il mercato interagisce con essa. L'indicatore monitora continuamente:
- Respingimenti
- Rotture
- Respingimenti Forti
- Rotture Forti
- Età del Livello
- Formazione dello Swing
Man mano che le condizioni di mercato cambiano, i livelli possono automaticamente acquisire importanza, diventare livelli di swing significativi o scadere quando non sono più rilevanti.
Questo crea un quadro di supporto e resistenza dinamico che riflette il comportamento reale del mercato piuttosto che linee storiche statiche.
Bande dinamiche invece di linee singole
I mercati raramente reagiscono a un prezzo esatto.
Per questo motivo, SC Supports & Resistances rappresenta ogni livello come una zona di prezzo dinamica, la cui dimensione si adatta automaticamente alla volatilità tramite calcoli ATR.
Questo fornisce una rappresentazione più realistica delle aree di domanda e offerta riducendo i falsi segnali generati da penetrazioni di prezzo insignificanti.
Il risultato è una visione più pulita e accurata di dove i partecipanti al mercato stanno realmente difendendo il prezzo.
Segnali di trading basati sulle reazioni
Ogni interazione con una zona di supporto o resistenza viene valutata in tempo reale.
Quando il prezzo respinge una zona, l'indicatore genera segnali direzionali chiari. Quando il prezzo supera con successo un livello, vengono generati segnali di breakout classificati in base alla loro forza.
Questo permette ai trader di identificare immediatamente:
- Opportunità di inversione potenziali
- Setup di continuazione del trend
- Conferme di breakout
- Tentativi di breakout falliti
- Zone di reazione istituzionali di alto interesse
Gestione automatica del ciclo di vita dei livelli
Una delle sfide più grandi nel trading di supporto e resistenza è determinare quando un livello non è più rilevante.
SC Supports & Resistances gestisce automaticamente l'intero ciclo di vita di ogni livello tramite una logica intelligente di scadenza basata su:
- Inattività del mercato
- Gap di prezzo
- Comportamento di breakout
- Comportamento di respingimento
- Logica di conferma dello swing
Il risultato è un grafico che rimane focalizzato solo sui livelli che contano ancora, eliminando il disordine inutile e le informazioni obsolete.
Perché usare SC Supports & Resistances
Supporto e resistenza rimangono tra i concetti più importanti nell'analisi tecnica, eppure molti trader tracciano ancora i livelli manualmente, portando a interpretazioni soggettive e risultati incoerenti.
SC Supports & Resistances elimina questa incertezza fornendo un approccio oggettivo e basato su regole per identificare e gestire i livelli chiave di mercato.
Questo permette ai trader di:
✔ Identificare più rapidamente zone di reazione ad alta probabilità
✔ Misurare la forza dei livelli di supporto e resistenza
✔ Rilevare istantaneamente rotture e respingimenti significativi
✔ Migliorare il timing di entrata e uscita
✔ Ridurre il disordine sul grafico
✔ Fare trading con maggiore fiducia e coerenza
Perfetto per
- Trader di Price Action
- Scalper
- Day Trader
- Swing Trader
- Trader di Trend
- Trader Smart Money Concept (SMC)
- Trader di Supporto & Resistenza
- Analisti Tecnici Professionisti
Nota importante
SC Supports & Resistances identifica i livelli utilizzando pivot di mercato confermati e calcoli di volatilità adattivi.
La qualità e la frequenza dei livelli generati dipendono dalle impostazioni di sensibilità e dai parametri di reazione selezionati.
Regolando queste impostazioni, i trader possono adattare l'indicatore a diversi mercati, stili di trading e timeframe.
Identifica i livelli. Misura le reazioni.
Fai trading su ciò che conta.
Riepilogo
Key functionalities include automatic detection and expiration of levels, intelligent swing-level recognition, and customizable sensitivity settings. Visual outputs feature dynamic bands, arrows, labels, and statistics to clearly represent zones and market reactions. This tool supports all markets and timeframes, providing objective, rules-based identification of key price levels to assist traders in recognizing potential reversals, trend continuations, breakout confirmations, and institutional reaction zones.
SC Supports & Resistances is suitable for various trading styles, including price action, scalping, day trading, swing trading, trend trading, and Smart Money Concept approaches. It aims to reduce chart clutter and improve entry and exit timing by maintaining a living framework of relevant support and resistance levels that evolve with market behavior.


