คำอธิบาย
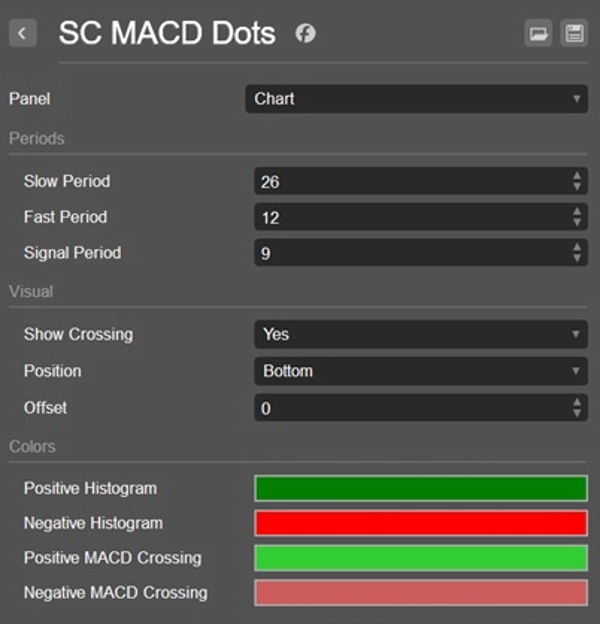
SC MACD Dots
SC MACD Dots เป็นเวอร์ชันมินิมัลลิสต์ของตัวบ่งชี้ MACD คลาสสิก ออกแบบมาเพื่อให้มุมมองที่สะอาดและเข้าใจง่ายขึ้นเกี่ยวกับโมเมนตัมโดยไม่ทำให้กราฟรกด้วยแถบฮิสโตแกรมแบบดั้งเดิมและเส้นหลายเส้น
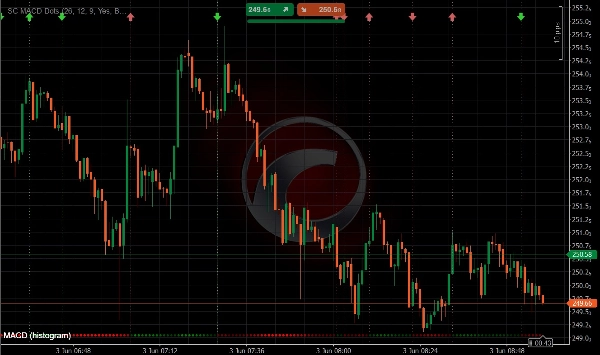
แทนที่จะโชว์ฮิสโตแกรม MACD แบบมาตรฐาน ตัวบ่งชี้นี้ใช้จุดแบบไดนามิกเพื่อแสดงค่าฮิสโตแกรมตามเวลา วิธีนี้สร้างเลย์เอาต์ที่ทันสมัยและมีประสิทธิภาพทางสายตาที่ช่วยให้นักเทรดสามารถระบุการเปลี่ยนแปลงโมเมนตัม การเร่งความเร็วแนวโน้ม และการกลับตัวที่อาจเกิดขึ้นได้ทันที
จุดเหล่านี้ปรับสีและความเข้มตามความแข็งแกร่งของฮิสโตแกรม ทำให้ง่ายต่อการรับรู้โมเมนตัมที่เพิ่มขึ้นหรือลดลงในพริบตา
นอกจากนี้ SC MACD Dots ยังเน้นการตัดกันของเส้นสัญญาณ MACD โดยอัตโนมัติ ช่วยให้นักเทรดสามารถระบุการเปลี่ยนแปลงแนวโน้มและการเปลี่ยนแปลงโมเมนตัมที่อาจเกิดขึ้นได้อย่างรวดเร็ว
คุณสมบัติหลัก
• ฮิสโตแกรมแสดงโดยใช้จุดแบบไดนามิกแทนแถบแบบดั้งเดิม
• รูปลักษณ์กราฟที่สะอาดและไม่รบกวนสายตามากขึ้น
• สีและความเข้มของจุดเปลี่ยนแปลงแบบไดนามิกตามความแข็งแกร่งของฮิสโตแกรม
• การระบุด้วยสายตาทันทีของโมเมนตัมที่เพิ่มขึ้นและลดลง
• การตรวจจับเหตุการณ์การตัดกันของ MACD โดยอัตโนมัติ
• สีที่แตกต่างกันสำหรับการตัดขึ้นและตัดลง
• การตัดกันในโซนบวกและโซนลบใช้สไตล์ภาพที่แตกต่างกัน
• การตีความภาพของการเปลี่ยนแปลงโมเมนตัมและการกลับตัวของแนวโน้มที่รวดเร็วขึ้น
• เหมาะสำหรับการสแคปปิ้ง การเทรดภายในวัน การเทรดสวิง และการเทรดแบบดุลยพินิจ
การแสดงภาพการตัดกัน
SC MACD Dots เน้นทุกเหตุการณ์การตัดกันของ MACD:
• การตัดขึ้น (กระทิง) แสดงด้วยสีเฉพาะสำหรับกระทิง
• การตัดลง (หมี) แสดงด้วยสีเฉพาะสำหรับหมี
• การตัดกันที่เกิดขึ้นเหนือเส้นศูนย์ (พื้นที่ MACD บวก) ใช้ชุดสีที่แตกต่างจากที่เกิดขึ้นใต้เส้นศูนย์ (พื้นที่ MACD ลบ)
• สิ่งนี้ช่วยให้นักเทรดแยกแยะสัญญาณโมเมนตัมที่แข็งแกร่งและอ่อนแอได้ทันที
ทำไมต้องใช้ SC MACD Dots
ตัวบ่งชี้ MACD แบบดั้งเดิมมักต้องให้นักเทรดติดตามเส้นและแถบฮิสโตแกรมหลายเส้นพร้อมกัน ซึ่งอาจทำให้กราฟดูรกและอ่านยาก
SC MACD Dots ถูกสร้างขึ้นด้วยเป้าหมายเดียว:
เพื่อทำให้ง่ายต่อการวิเคราะห์ MACD ในขณะที่ยังคงข้อมูลโมเมนตัมที่จำเป็นทั้งหมดไว้
การแสดงภาพจุดแบบปรับตัวช่วยให้นักเทรดประเมินความแข็งแกร่งของฮิสโตแกรม การเร่งและชะลอโมเมนตัม รวมถึงสัญญาณการตัดกันได้อย่างรวดเร็วโดยไม่ถูกรบกวนจากองค์ประกอบภาพที่ไม่จำเป็น
โดยการรวมจุดฮิสโตแกรมแบบไดนามิกกับการแสดงภาพการตัดกันอย่างชาญฉลาด นักเทรดสามารถระบุโอกาสได้เร็วขึ้นและรักษาพื้นที่ทำงานการเทรดที่สะอาด
เหมาะสำหรับ
• นักเทรดที่ชอบกราฟที่สะอาด
• นักเทรดโมเมนตัม
• สแคปเปอร์และนักเทรดรายวัน
• นักเทรดสวิง
• การตั้งค่าการเทรดหลายตัวบ่งชี้
• การวิเคราะห์ตลาดอย่างรวดเร็ว
• นักเทรดที่พึ่งพาสัญญาณการตัดกันของ MACD
หมายเหตุสำคัญ
SC MACD Dots ถูกออกแบบมาให้ใช้โดยตรงบนกราฟราคาหลัก
แตกต่างจากตัวบ่งชี้ MACD แบบดั้งเดิม แนวคิดภาพของมันถูกสร้างขึ้นโดยรอบการรวมข้อมูลโมเมนตัมเข้ากับการวิเคราะห์การเคลื่อนไหวของราคา ด้วยเหตุนี้ การใช้ตัวบ่งชี้ในแผงแยกจึงไม่แนะนำและไม่ให้ประสบการณ์ผู้ใช้ตามที่ตั้งใจไว้
เรียบง่าย สะอาด และทรงพลัง
สรุป
รีวิวจากลูกค้า
5 | 100 % | |
4 | 0 % | |
3 | 0 % | |
2 | 0 % | |
1 | 0 % |