
Descrizione
Prezzo promozionale: $500 Approfitta della tua occasione. Il prezzo torna a $697 dopo un numero prestabilito di copie APEX scaricate.
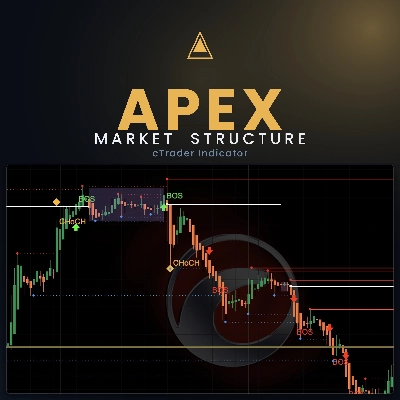
Apex Market Structure è un overlay di precisione, non ridipinto, che mappa la struttura sotto il prezzo su qualsiasi strumento e qualsiasi timeframe in cTrader. Legge le tre fasi del mercato: Contrazione, Espansione e Trend, e le mostra in tempo reale davanti a te.
COSA ANALIZZA
L'indicatore legge la struttura del mercato direttamente dall'azione del prezzo a barra chiusa: massimi e minimi oscillanti (pool di liquidità), rotture di struttura (BOS) e cambiamenti di carattere (CHoCH), periodi di compressione della volatilità (zone di contrazione, misurate dall'ATR), le fasi di espansione e trend che seguono, e il bias di trend a timeframe superiore dalle EMA Daily e 4 ore. Non richiede dati esterni, solo il prezzo sul tuo grafico.
ELEMENTI VISIVI
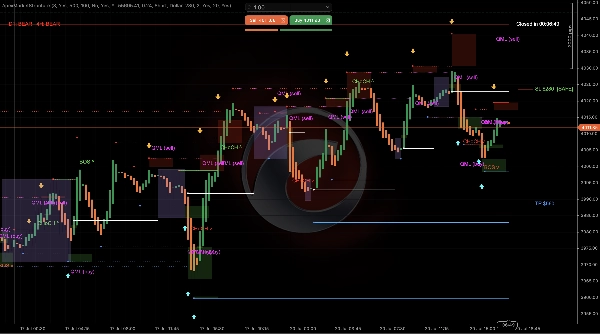
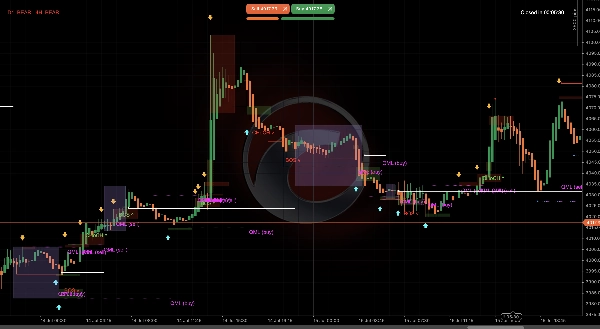
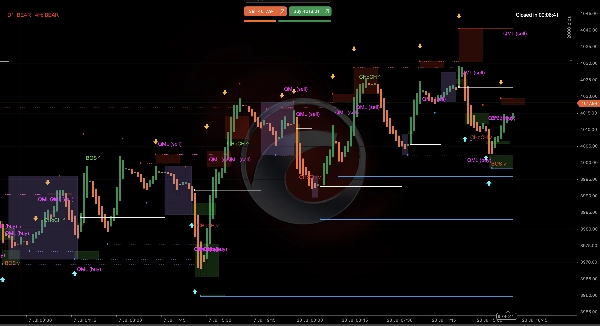
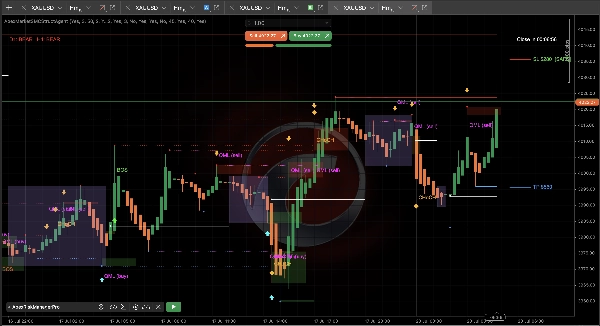
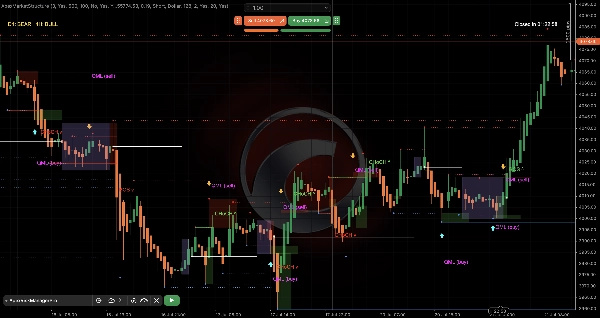
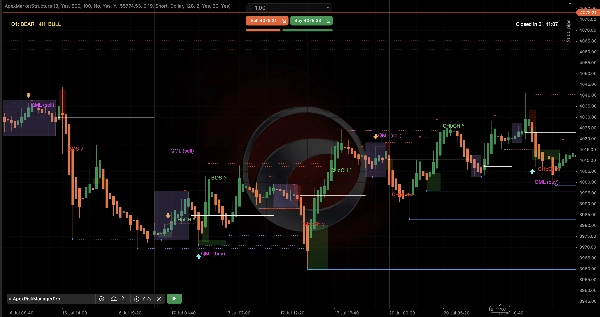
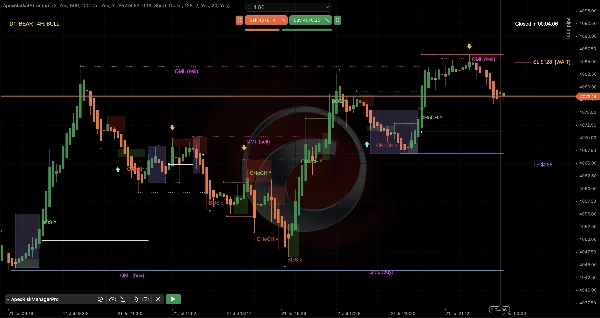
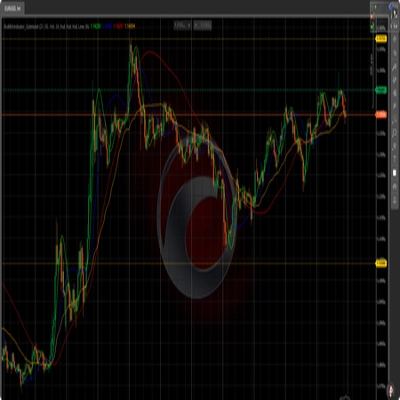
- Livelli di liquidità: massimi oscillanti (rosso) e minimi (blu) proiettati in avanti come pool di stop in attesa. I livelli non spazzati continuano ad estendersi; una volta che il prezzo li raggiunge, si congelano e diventano tratteggiati.
- Etichette BOS / CHoCH: una Rottura di Struttura indica continuazione; un Cambiamento di Carattere indica una potenziale inversione. Ognuna appare solo su una barra chiusa confermata.
- Frecce di ingresso: una freccia per ogni rottura di struttura confermata, opzionalmente filtrata secondo il tuo bias a timeframe superiore.
- Riquadri di contrazione: zone riempite che mostrano accumulo/compressione, spesso precedenti all'espansione.
- Linea di valore (bianca): un livello di riferimento tracciato da ogni contrazione.
- Bias HTF: una lettura del trend Daily + 4H mostrata su ogni grafico, mantenendo le decisioni a timeframe inferiore allineate con il quadro più ampio.
- Indicatore di rischio pre-ingresso: segmenti SL e TP fluttuanti accanto al prezzo corrente, dimensionati in base al tuo saldo, dimensione lotto e rischio, con un verdetto SAFE/WAIT misurato rispetto al livello di liquidità non spazzato più vicino, avvisandoti quando uno stop si trova davanti a liquidità che il mercato potrebbe ancora raggiungere. Hai due opzioni in (%) o valuta (USD, EUR,....
IMPOSTAZIONI E PARAMETRI CHIAVE
Ogni livello è attivabile indipendentemente. Le impostazioni regolabili includono la forza dello swing (minore e maggiore), il numero e lo spessore delle linee di liquidità, il periodo ATR e il rapporto di compressione, il numero minimo di barre di contrazione, il periodo EMA per il bias, la modalità filtro bias (solo D1 / solo H4 / entrambi d'accordo), il rapporto rischio/ricompensa, la modalità rischio (percentuale o dollaro), e opzionalmente VWAP, avvisi (suono e pop-up), punti e un conto alla rovescia live per la chiusura della barra.
CASI D'USO TIPICI
- Identificare dove risiede la liquidità istituzionale prima di un movimento.
- Leggere se il mercato sta accumulando (contrazione), espandendo o trendando.
- Allineare gli ingressi intraday con la direzione a timeframe superiore.
- Dimensionare un trade e controllare la posizione dello stop rispetto alla liquidità reale prima di entrare.
- Costruire la disciplina per superare una sfida prop-firm / conto finanziato.
IDEALE PER
Trader discrezionali che utilizzano concetti di struttura di mercato e smart-money e vogliono una mappa strutturale pulita e accurata più una dimensione del rischio pre-ingresso disciplinata. Adatto a tutti i livelli di esperienza, su qualsiasi strumento e timeframe, su cTrader.
LIMITAZIONI IMPORTANTI E NOTE D'USO
Per risultati ottimali, usa le candele Heikin Ashi in cTrader. Questo è un indicatore NON RIDIPINTO: ogni oggetto persistente è creato solo da una barra chiusa, mai dalla candela in formazione. Il grafico appare identico sia costruito in tempo reale sia ricalcolato al caricamento. Il compromesso è che il segnale più recente appare una barra dopo la chiusura della candela che lo ha prodotto, questo è intenzionale. L'indicatore è uno strumento di analisi tecnica soltanto; non esegue operazioni e non è un consiglio finanziario. Il trading comporta un rischio sostanziale di perdita, e sei responsabile delle tue decisioni di trading. Usa Apex Market Structure come tua mappa, ma ricorda, sei tu il guidatore.
Aggiunte
Vedi cosa sta davvero facendo il mercato. Vedi le 3 fasi di mercato in diretta davanti a te (Contrazione, Espansione, Fasi di Trend) e ottieni ingressi migliori nella fase iniziale del trend.
Smetti di indovinare. Inizia a leggere il mercato come fanno le istituzioni, lo Smart Money.
Indicatore Apex Market Structure per cTrader è uno strumento di analisi smart-money di precisione che elimina il rumore e ti mostra la vera struttura sotto ogni candela; liquidità, cambiamenti di struttura, zone di accumulo e bias di trend. Tutto in un unico overlay pulito e professionale. Creato per trader seri che hanno finito con gli indicatori ritardati e sono pronti a operare con chiarezza.
⚠️ IMPORTANTE: Questo indicatore è progettato per funzionare su qualsiasi grafico, ma con le candele HEIKIN ASHI avrai una visuale migliore. L'intera analisi è progettata per aiutarti con un grafico chiaro.
Perché i trader scelgono Apex Market Structure:
🎯 Liquidità, Esposta — Vedi istantaneamente dove si trovano i pool di stop. La liquidità lato vendita e lato acquisto è mappata automaticamente. Osserva i livelli non spazzati in tempo reale e vedi il momento esatto in cui il prezzo prende liquidità e si gira. Opera dove opera lo smart money.
📊 Struttura che Parla — Rottura di Struttura e Cambiamento di Carattere sono etichettati nel momento in cui si confermano. Saprai quando un trend continua e quando sta per invertire. Nessun secondo tentativo, Nessun ridipinto.
🟪 Zone di Accumulo — Individua la compressione prima dell'espansione. Apex evidenzia le zone strette e avvolte dove nascono i grandi movimenti, complete di una linea di valore di equilibrio.
➡️ Segnali di Ingresso Puliti — Indicatori nitidi e inequivocabili si attivano su eventi di struttura confermati. Punti di continuazione e inversione sono chiaramente distinti, così sai sempre cosa stai guardando.
🧭 Conosci Sempre il Quadro Generale — Una lettura live del bias Daily e 4 ore ti mantiene allineato con il trend dominante. Non ti troverai mai più a combattere contro il timeframe superiore.
⚖️ Indicatore di Rischio Integrato — Uno strumento visivo di dimensionamento pre-ingresso che mappa il tuo stop-loss e take-profit dal tuo saldo, dimensione lotto e rischio. Ti dice istantaneamente se il tuo stop è posizionato in sicurezza oltre la liquidità vicina. Funziona perfettamente su ogni simbolo e ogni timeframe.
⏱️ Mantieni il Controllo — Un conto alla rovescia live per la chiusura della candela e una visualizzazione sul grafico ti tengono perfettamente sincronizzato e informato.
🔔 Non Perdere Mai un Movimento — Avvisi pop-up, sonori, push e email per ogni evento chiave — rotture di struttura, spazzate di liquidità, nuove zone e ingressi. L'armamento intelligente significa zero spam di avvisi all'avvio.
Cosa lo distingue:
✅ 100% Non Ridipinto — Ogni segnale si blocca alla chiusura della candela e non si sposta mai. Quello che vedi è sempre stato lì.
✅ Qualsiasi Mercato, Qualsiasi Timeframe — Oro, forex, indici, crypto — Apex li legge tutti.
✅ Completamente Personalizzabile — Ogni livello si attiva o disattiva e si regola secondo il tuo stile esatto.
✅ Zero Ingombro — Una lettura strutturale completa, splendidamente pulita.
Apex Market Structure non opera per te. Fa qualcosa di meglio. Ti offre la stessa chiarezza strutturale su cui si affidano i trader professionisti e istituzionali, e rimette la decisione dove appartiene: a te.
Imposta il tuo grafico su Heikin Ashi. Aggiungi Apex Market Structure. Vedi il mercato chiaramente. Usa il tuo D1, H4 come GPS e il Trigger nei timeframe bassi.
"Gli acquirenti ricevono supporto e guida continui per ottenere il massimo da Apex Market Structure sulla piattaforma cTrade."
Riepilogo
The indicator visually maps liquidity levels, labels confirmed BOS and CHoCH events, highlights contraction zones with value lines, and displays entry arrows filtered by higher-timeframe bias. It includes a pre-entry risk gauge that calculates stop-loss and take-profit levels based on user balance, lot size, and risk, indicating whether stops are safely placed relative to nearby liquidity.
Users can customize settings such as swing strength, liquidity line count, ATR parameters, bias filter mode, reward-to-risk ratio, and alert options. Apex Market Structure supports all markets including forex, indices, gold, and crypto, and is optimized for use with Heikin Ashi candles for clearer visualization.
Designed for discretionary traders employing market structure and smart-money concepts, it aids in identifying institutional liquidity, market phases, and aligning entries with higher-timeframe trends while providing disciplined risk sizing and timing tools.
Recensioni dei clienti
Discussioni
Domande frequenti
Altro da questo autore

Potrebbe interessarti anche

Prezzo
