VIX - volatility indicator - Renko
Indicatore
Versione 1.0, Feb 2025
Windows, Mac
Descrizione
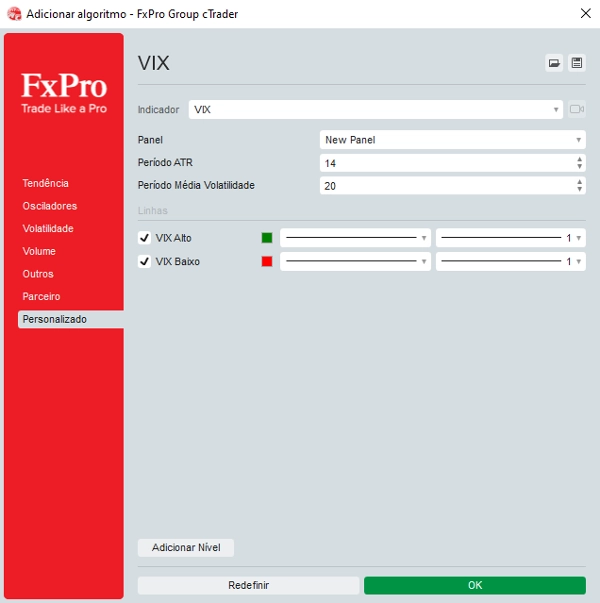
Regola i parametri: inserisci i valori desiderati per i livelli LowLevel e HighLevel, e regola il Fattore di Scala VIX in modo che la linea VIX abbia l'altezza desiderata.
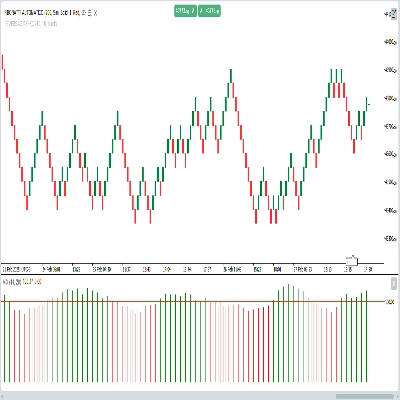
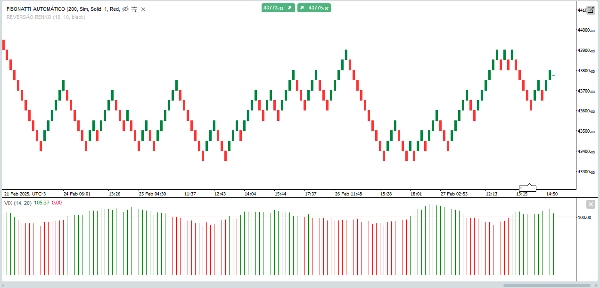
Guarda il grafico:
Quando il VIX supera l'HighLevel e il volume è alto (candele verdi), puoi considerare che c'è una rottura.
Quando il VIX è sotto il LowLevel, potrebbe indicare un periodo di bassa volatilità.
Riepilogo
Profilo indicatore
Recensioni dei clienti
0.0
Recensioni: 0
Recensioni dei clienti
Questo prodotto non ha ancora ricevuto recensioni. L'hai già provato? Fallo sapere agli altri per primo!
Discussioni
Domande frequenti
Breakout
I prodotti disponibili tramite cTrader Store, inclusi bot di trading, indicatori e plugin, sono forniti da sviluppatori terzi e resi disponibili esclusivamente a scopo informativo e di accesso tecnico. cTrader Store non è un broker e non fornisce consulenze in materia di investimento, raccomandazioni individualizzate o garanzie di risultati futuri.


![Logo di "[CB] Pivot Points Pro"](https://cdn.ctrader.com/image/webp/43463c82-67b0-4f10-a4ba-901bba091d81_32594)


Prezzo
Da 05/02/2025
30
Vendite