
Descrizione
📌 Descrizione per il Store cTrader – Francese 🇫🇷
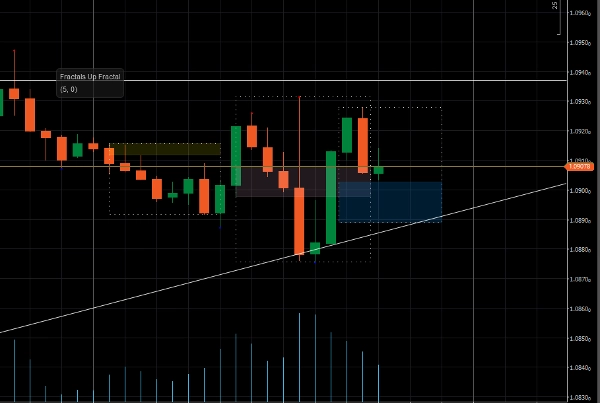
🔍 Indicatore [LDE] OPR & Market Sessions – Visualizzazione chiara delle sessioni!
Questo indicatore evidenzia le principali sessioni di mercato (Tokyo, Londra, New York) mostrando rettangoli dinamici sul tuo grafico.
✔ Visualizzazione delle sessioni personalizzabile 🏙️
✔ Visualizzazione dei livelli High/Low per sessione 📈
✔ Evidenziazione dell'Open Price Range (OPR) ⏳
✔ Trasparenza regolabile per una migliore leggibilità 🎨
✔ Compatibile con tutti gli asset e timeframe ⏰
🔧 Impostazioni flessibili : attiva/disattiva ogni sessione, regola i colori e personalizza la visualizzazione degli H/L per ogni sessione.
🚀 Ottimizza il tuo trading identificando a colpo d’occhio le zone chiave del mercato!
📌 Description for cTrader Store – English 🇬🇧
🔍 [LDE] OPR & Market Sessions Indicator – Clear visualization of sessions!
This indicator highlights major market sessions (Tokyo, London, New York) by displaying dynamic rectangles on your chart.
✔ Customizable session display 🏙️
✔ Session-specific High/Low visualization 📈
✔ Highlighting of the Open Price Range (OPR) ⏳
✔ Adjustable transparency for better readability 🎨
✔ Compatible with all assets and timeframes ⏰
🔧 Flexible settings: enable/disable each session, adjust colors, and personalize the High/Low display for each session.
🚀 Optimize your trading by identifying key market zones at a glance!
Riepilogo
Recensioni dei clienti
5 | 0 % | |
4 | 100 % | |
3 | 0 % | |
2 | 0 % | |
1 | 0 % |


