
// ══════════════════════════════════════ ══════════════════════════════════════
// 📊 INDICATOR EMA ON TF (マルチタイムフレーム)
// バージョン: 1.0.0 - マルチタイムフレーム分析のためのプロフェッショナルインジケーター
// 作者: Fury Team - Armando Brecciaroli
// 日付: 2025年6月5日
// ══════════════════════════════════════════════════════════════════════════
//
// 説明:
// ===========
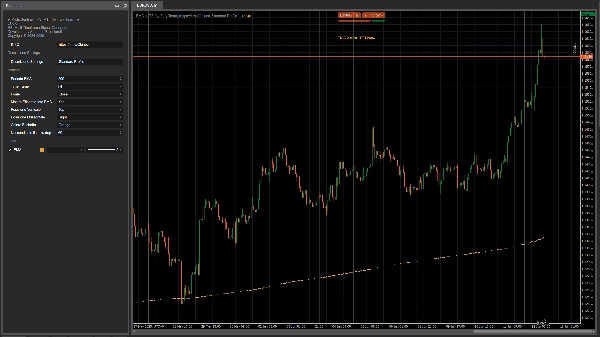
// EMA on TFは、特定のタイムフレームで計算された指数移動平均(EMA)を表示し、
// 現在のチャートのタイムフレームに投影する高度なインジケーターです。
// このツールにより、より高いタイムフレーム(例:H4、D1)の移動平均を、
// より低いタイムフレーム(M15、H1)のチャート上でも使用でき、
// 完全かつ即時のマルチタイムフレーム分析を可能にします。
//
// 主な特徴:
// ==========================
// - 任意のタイムフレームのEMAを現在のチャートに表示
// - cTraderで利用可能なすべてのタイムフレームを完全サポート
// - EMA期間と価格ソースの完全カスタマイズ
// - 柔軟な位置調整が可能な情報ラベルの管理
// - 安全なライセンスシステムと自動更新チェック
// - 大規模データセットでも高性能を実現する完全最適化
// - 視覚的外観(色、ラインスタイル)の完全カスタマイズ
//
// 実用例:
// ================
// - 低いタイムフレームチャートでの長期トレンドの特定
// - 高いタイムフレームの重要な平均値の表示
// - 移動平均に基づくマルチタイムフレーム戦略の作成
// - より信頼性の高い動的サポートとレジスタンスの特定
//
// 変更履歴:
// =========
// v1.0.0 (2025/06/05)
// - すべてのタイムフレームを完全サポートした初期リリース
// - 高度なライセンス管理システムの実装
// - 情報豊富なHUDを備えたカスタマイズ可能なユーザーインターフェース
// - チャート上に情報ラベルを追加
// - 自動更新システムを統合
// - 拡張された時系列データに対するパフォーマンス最適化
// - すべての価格ソース(終値、始値、高値、安値など)をサポート
// - システムメッセージ表示の自動管理
// ═══════════════════════════════════════════════════════════════════════════════
ライセンスを有効にするには、画面またはログの情報に従ってください。
5 | 0 % | |
4 | 100 % | |
3 | 0 % | |
2 | 0 % | |
1 | 0 % |


