説明
より良いカスタマイズ性と柔軟性を備えたトレーディング分析のために設計された強化された移動平均インジケーターのご紹介です。
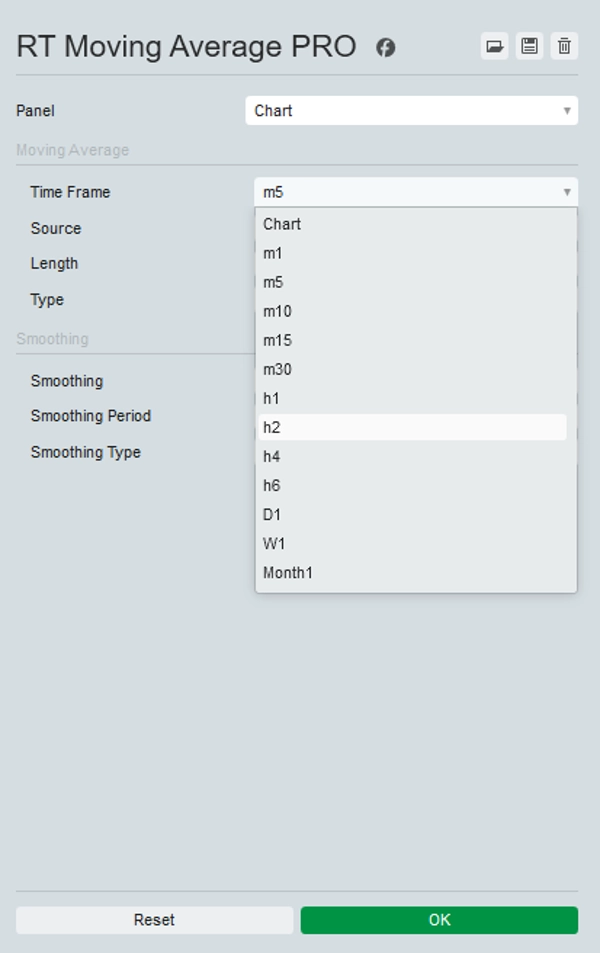
この強化版は、ティックタイムフレームや平均足に対しても高い時間足の移動平均をサポートします。レンコおよびレンジ期間はまだサポートされていません。
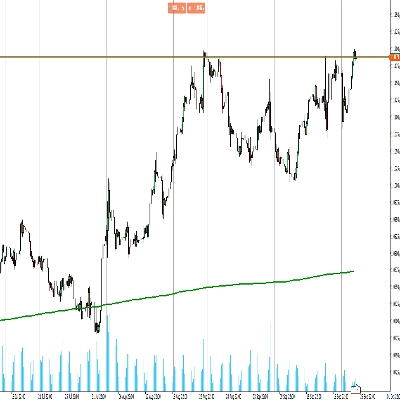
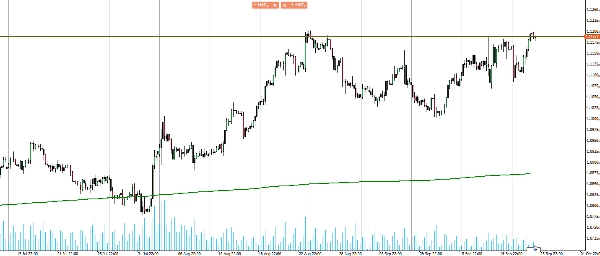
このインジケーターでは任意の時間足を選択でき、例えば任意の時間足で日足の200MAを表示することが可能です。
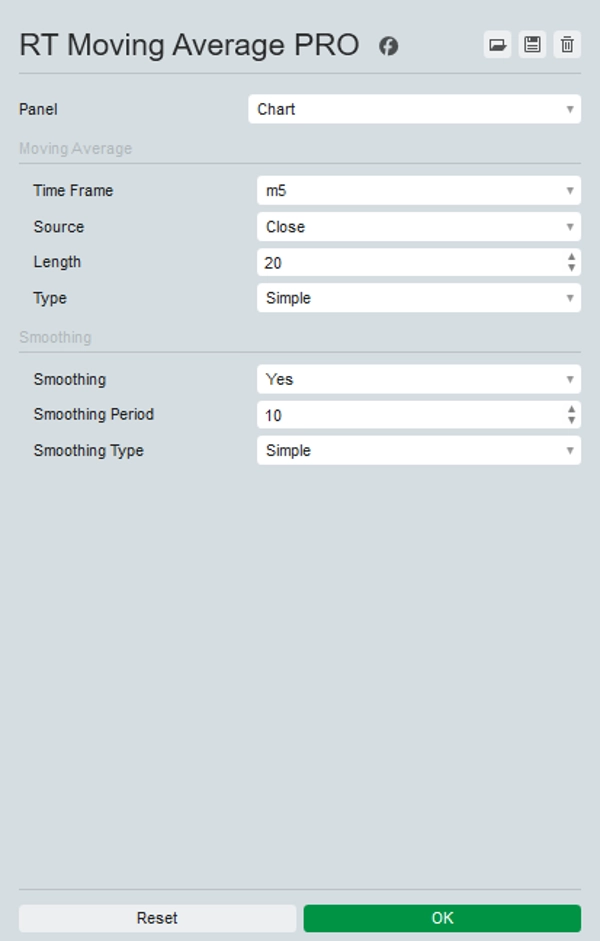
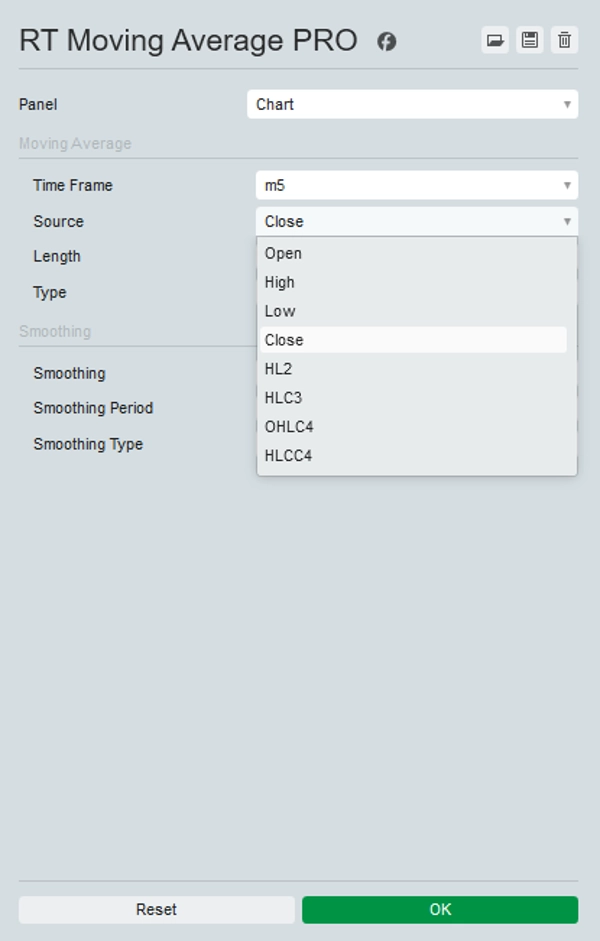
さらに、始値、高値、安値、終値、HL2、HLC3、OHLC4、およびHLCC4など、TradingViewと同様の価格ソースの選択肢を提供し、低時間足でのサンプリング問題に対応するためのオプションの平滑化機能も備えています。
これらのオプションを提供することで、移動平均を特定のトレーディング戦略に合わせて調整し、市場動向に関するより正確な洞察を得ることができます。
強化された移動平均インジケーターでトレーディングツールキットをアップグレードし、優れた分析と意思決定を実現しましょう。
概要
インジケーターのプロフィール
カスタマーレビュー
0.0
レビュー: 0
カスタマーレビュー
この商品にはまだレビューがありません。お使いになったことがある方は、ぜひレビューをお願いします。
ディスカッション
よくあるご質問
BTCUSD
Forex
Indices
EURUSD
Commodities
GBPUSD
NZDUSD
Prop
Crypto
Stocks
XAUUSD
NAS100
USDJPY
cTrader Storeで入手可能な取引ボット、インジケーター、プラグインなどの商品は、第三者の開発者が提供するものであり、情報と技術の取得のみを目的としてご利用いただけます。cTrader Storeはブローカーではなく、投資助言や個人的な推奨を行うことも、将来のパフォーマンスを保証することもありません。
これも好きかも


価格
登録日 25/09/2024
20
販売