
説明
概要
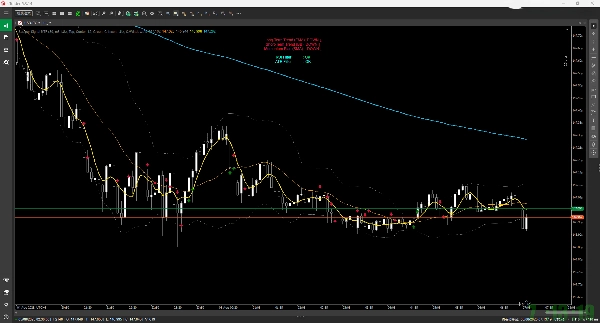
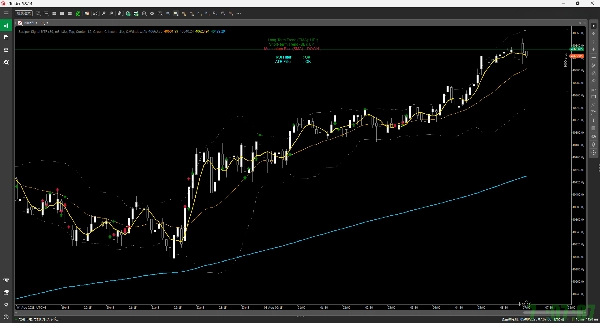
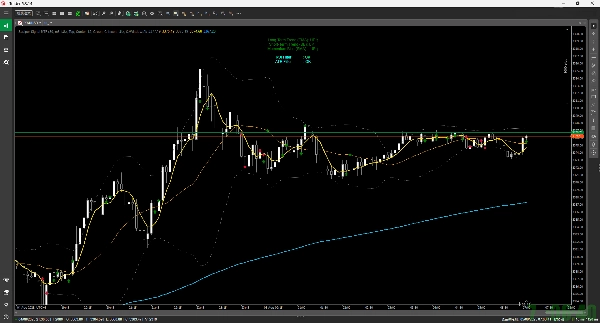
指定された時間枠(例:5分足)のテクニカル指標に基づき、現在のチャートに買い/売りシグナル(矢印)を表示します。また、シグナル発生後の取引をシミュレートし、潜在的な出口ポイントにマーク(星)をプロットします。
主な特徴
- 買い/売りシグナル表示:
-
- 買いシグナル(上矢印): SMA(単純移動平均)のゴールデンクロスに基づき、RSI、200 EMA、ボリンジャーバンドの条件と組み合わせて有利な買いの機会を特定します。
- 売りシグナル(下矢印): SMAのデッドクロスに基づき、RSI、200 EMA、ボリンジャーバンドの条件と組み合わせて有利な売りの機会を特定します。
- 取引シミュレーション:
-
- シグナル発生後、以下のいずれかの条件が満たされた場合に取引が終了したと仮定し、チャートに星アイコンでマークします:
-
- 利益確定/損切り(ATRおよび指定されたリスク:リワード比に基づく)。
- ボリンジャーバンド(上部/下部バンドまたは中央線)への接触。
- 最大保有時間の超過。
- ブレイクイーブンおよびトレーリングストップも内部で計算されます。
- ダッシュボード表示:
-
- チャートの左上に現在の市場環境の簡単な概要を表示し、長期トレンド(EMA)、短期トレンド(BB)、モメンタム(SMA)を含みます。
- アラート機能:
-
- 新しいシグナルが生成されたときに音声通知を提供します。
パラメーター
インジケーターの設定で以下の項目を自由にカスタマイズできます:
- 計算に使用する時間枠(MTF)。
- 各種指標の期間(SMA、RSI、BB、EMA)。
- 取引終了ルール(例:リスク:リワード比、最大保有時間)。
- シグナルおよびダッシュボードの表示設定(表示/非表示、色、サイズ)。
概要
AIによる概要
Scalper Signal MTF is a custom indicator designed for the cTrader platform that provides multi-timeframe scalping signals. It analyzes technical indicators from a chosen timeframe—such as 5 minutes—and displays buy (up arrow) and sell (down arrow) signals on the current chart. Buy signals are generated based on an SMA golden cross combined with RSI, 200 EMA, and Bollinger Bands conditions; sell signals use an SMA dead cross with similar criteria.
The indicator simulates trades after signals appear and marks potential exit points with a star icon. Trade exits are triggered by take profit or stop loss levels (calculated using ATR and a specified risk-reward ratio), touching Bollinger Bands, exceeding maximum holding time, or internal breakeven and trailing stop calculations.
A dashboard on the chart’s top-left summarizes the current market environment, showing long-term trend (EMA), short-term trend (Bollinger Bands), and momentum (SMA). The indicator also provides sound alerts when new signals occur.
Users can customize the timeframe for calculations, indicator periods (SMA, RSI, BB, EMA), trade exit rules, and display settings including signal and dashboard visibility, colors, and sizes.
インジケーターのプロフィール
カスタマーレビュー
0.0
レビュー: 0
カスタマーレビュー
この商品にはまだレビューがありません。お使いになったことがある方は、ぜひレビューをお願いします。
ディスカッション
よくあるご質問
cTrader Storeで入手可能な取引ボット、インジケーター、プラグインなどの商品は、第三者の開発者が提供するものであり、情報と技術の取得のみを目的としてご利用いただけます。cTrader Storeはブローカーではなく、投資助言や個人的な推奨を行うことも、将来のパフォーマンスを保証することもありません。
この作成者の他の商品


価格
1
販売
1.37K
無料インストール