
WAVETREND_withSourceCode
インジケーター
バージョン 1.0、Oct 2025
Windows、Mac
5.0
レビュー: 2
説明
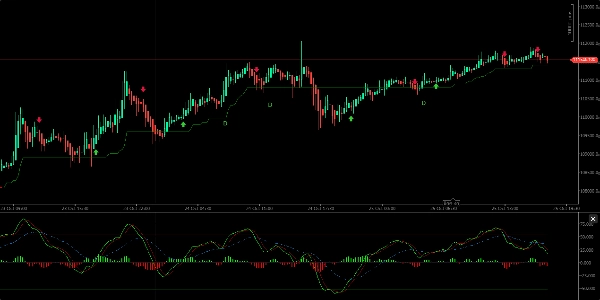
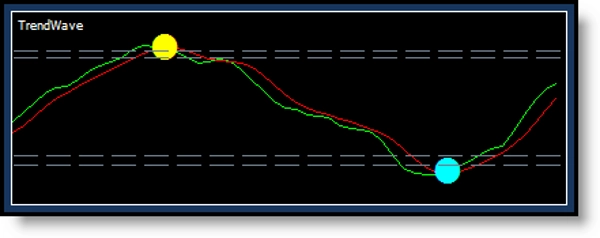
買い・売りのシグナル、トレンド方向の指示を提供し、買われ過ぎおよび売られ過ぎのゾーンを特定します。視覚的には、中央にクラウド/ヒストグラムがあり、2本の値のラインで構成されており、ミッドラインの上と下を移動し、上昇または下降のトレンドを表します。
主な特徴:
- 緑のラインが赤のラインを上向きにクロスすると買いシグナル、緑のラインが下向きにクロスすると売りシグナルが発生します。
- クラウドの波がミッドラインの上または下にあることでトレンドの方向を示します。
- インジケーターはクロスポイントに緑(買い)と赤(売り)のドットを表示し、それに対応してローソク足の色も変わります(買いは黄色、売りはターコイズ)。
- 過度な短期ノイズを避けるため、12時間または1日の間隔での使用が最適です。
- 価格とモメンタムの間のダイバージェンス(通常の強気および弱気のダイバージェンス)を識別し、潜在的な価格反転を示します。
- より信頼性の高い取引判断のために、WaveTrendはWMA、CMF、RSI、MACDなどの他のインジケーターと組み合わせて使用することが推奨されます。
総じて、WaveTrendはトレンド方向と取引シグナルの識別に役立つ機能的なツールですが、確認のために他の分析ツールと併用すべきです。
概要
インジケーターのプロフィール
カスタマーレビュー
5.0
レビュー: 2
5 | 100 % | |
4 | 0 % | |
3 | 0 % | |
2 | 0 % | |
1 | 0 % |
カスタマーレビュー
November 6, 2025
the main upside is the trade idea gets slowed down first. The setup still needs say no.
ディスカッション
よくあるご質問
Signal
ZigZag
EURUSD
Supertrend
GBPUSD
RSI
XAUUSD
NAS100
ATR
MACD
cTrader Storeで入手可能な取引ボット、インジケーター、プラグインなどの商品は、第三者の開発者が提供するものであり、情報と技術の取得のみを目的としてご利用いただけます。cTrader Storeはブローカーではなく、投資助言や個人的な推奨を行うことも、将来のパフォーマンスを保証することもありません。
![「[Stellar Strategies] MARSI Signal Plotter」ロゴ](https://cdn.ctrader.com/image/webp/7b2b8da6-8f8e-4646-8d4a-4710c516c01e_25567)

![「[Hamster-Coder] Pivot Points MTF」ロゴ](https://cdn.ctrader.com/image/webp/4c143e5a-309c-40e3-a578-f04d1e133ffa_31159)


価格
登録日 16/03/2025
256
無料インストール