
Daily TPO profile
インジケーター
212 ダウンロード数
バージョン 1.0、Nov 2025
Windows、Mac
説明
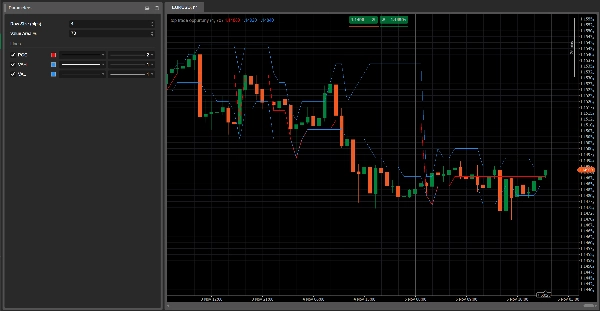
デイリーTPOプロファイル
各セッションのPOC、VAH、VALを計算するデイリーTPOプロファイルインジケーター。
チャート上にコントロールポイントと70%のバリューエリアを直接プロットし、公正価値ゾーン、主要なサポート/レジスタンスレベル、および価格の拒否または受け入れの可能性のある領域を特定するのに役立ちます。
仕組み
このインジケーターは、デイリーTPO(タイムプライスオポチュニティ)プロファイルを構築します。これはマーケットプロファイルに似ています。
取引日の各バーについて、以下を行います:
- 価格軸を「行サイズ(ピップ)」で定義された固定の「ステップ」に分割します
- 各価格ステップについて、そのレベルに触れたバーの数をカウントします(TPO = 価格がそのレベルで取引された回数)
- 1日の終わりに以下を計算します:
-
- POC(コントロールポイント) → 最も多くのTPOがある価格レベル(市場が最も長く滞在した場所)
- VAH(バリューエリアハイ) と VAL(バリューエリアロー) → そのセッションの全TPOの約バリューエリア%(デフォルトは70%)を含む価格レベル
インジケーターはチャート上に3本の水平線をプロットします:
- 赤い線 → POC
- 青い線 → VAH(上部)とVAL(下部)
これらの線はセッション中にバーごとに更新され、新しい取引日が始まるとリセットされます。
主なパラメーター
行サイズ(ピップ)
プロファイル内の各価格ステップの厚さを定義します。-
- 値が小さいほど詳細なプロファイルになります
- 値が大きいほど滑らかなプロファイルになります
バリューエリア%
バリューエリア内に含まれる総TPOの割合(通常は70%)。
バリューエリアは、その日の市場活動の大部分が発生した価格ゾーンです。
読み方
- POC(赤い線)
-
- その日に市場によって最も「受け入れられた」価格レベル。
- しばしば均衡レベルとして機能します:価格はこのゾーンで跳ね返ったり、停滞したり、強く突破したりすることがあります。
- バリューエリア(VAH–VAL、青い線)
-
- 取引の大部分が行われた「公正価値」ゾーンを表します。
- VAH/VALに対する価格の動きは以下を示すことがあります:
-
- 極端な価格の拒否(VAH/VALを超えた偽のブレイクアウト)
- 新しい価格の受け入れ(バリューエリア外での統合)
典型的な使用例
- 価格がVALを拒否し、バリューエリア内に戻る→「公正価値」への回帰(平均回帰)を狙ったロングの可能性。
- 価格がVAHを強く突破し、その上で構造を形成し始める→新しい高いバリューエリアの始まりの可能性(トレンドフォローシナリオ)。
- 数日間POCが同じレベル付近にある→強い均衡/蓄積ゾーンであり、しばしば重要なサポート/レジスタンス。
概要
AIによる概要
The Daily TPO Profile indicator constructs a daily Time Price Opportunity (TPO) profile similar to a Market Profile, analyzing market activity by price levels throughout each trading session. It divides the price axis into fixed increments ("Row Size" in pips) and counts how many bars traded at each price step, representing TPOs. At the end of the session, it calculates three key levels: the Point of Control (POC), where the market spent the most time; the Value Area High (VAH); and the Value Area Low (VAL), which together define the price range containing approximately 70% of the trading activity.
The indicator plots these levels as horizontal lines on the chart—POC in red, VAH and VAL in blue—updating them bar by bar during the session and resetting daily. Traders use the POC as an equilibrium price level that may act as support or resistance. The Value Area highlights fair value zones, with price action near VAH and VAL signaling potential rejection or acceptance of price extremes. Typical applications include identifying mean reversion opportunities when price rejects VAL or trend-following setups when price breaks above VAH.
Main adjustable parameters include Row Size (pips), controlling profile detail, and Value Area %, defining the percentage of TPOs included in the value area. The indicator supports analysis across various markets including forex, indices, commodities, stocks, and cryptocurrencies.
インジケーターのプロフィール
カスタマーレビュー
0.0
レビュー: 0
カスタマーレビュー
この商品にはまだレビューがありません。お使いになったことがある方は、ぜひレビューをお願いします。
ディスカッション
よくあるご質問
Signal
Indices
Commodities
GBPUSD
RSI
Bollinger
Fibonacci
Scalping
AI
XAUUSD
NAS100
MACD
BTCUSD
Forex
Breakout
EURUSD
NZDUSD
Martingale
Prop
ZigZag
Supertrend
Fair Value Gap
SMC
Crypto
Grid
Stocks
ATR
USDJPY
VWAP
cTrader Storeで入手可能な取引ボット、インジケーター、プラグインなどの商品は、第三者の開発者が提供するものであり、情報と技術の取得のみを目的としてご利用いただけます。cTrader Storeはブローカーではなく、投資助言や個人的な推奨を行うことも、将来のパフォーマンスを保証することもありません。


これも好きかも


![「[Hamster-Coder] Pivot Points MTF」ロゴ](https://cdn.ctrader.com/image/webp/4c143e5a-309c-40e3-a578-f04d1e133ffa_31159)

![「High-Low Divergence [Iridio Capital]」ロゴ](https://cdn.ctrader.com/image/webp/443c4661-7abb-40f1-842f-4b6ec560649b_40914)


価格
42.11M
取引数量
6.13M
獲得pips
221
販売
8.36K
無料インストール