説明
簡単な説明
Trend & Volume Regime Map は、価格と出来高の方向性と持続性を測定するcTrader用のレジームフィルターです。正規化されたトレンドスコアと出来高トレンドスコアを –10 から +10 の範囲で提供し、ローソク足を弱気の赤から強気の緑への滑らかなグラデーションで色付けし、現在の環境がリスクオン、リスクオフ、または単なるノイズかを示します。
🧠 何をするか
このインジケーターは、TradingViewのBigBelugaの「Regime Filter」のロジックをcTrader向けに適応し、明確な トレンド&出来高レジームマップ にまとめたものです。
平滑化された価格と出来高
- 価格の平滑化に HLC3(高値、安値、終値の平均)を計算し、Hull Moving Average (HMA) を適用します。
- 出来高のティックボリュームに別の Hull Moving Average を適用します。
トレンドスコア(価格)
- 直近の N本のバー(
Length) に対して、現在の価格のHMA と過去の各HMA値を比較します:
- 現在のHMA > 過去のHMA → トレンド +1
- 現在のHMA ≤ 過去のHMA → トレンド –1
- 累積スコアは –10 … +10 にスケーリングされ → これが トレンド値 です。
出来高トレンドスコア
- 同じロジックを用いますが、出来高のHMA に適用されます。
- 結果は別の正規化スコアで –10 … +10 → これが 出来高値 です。
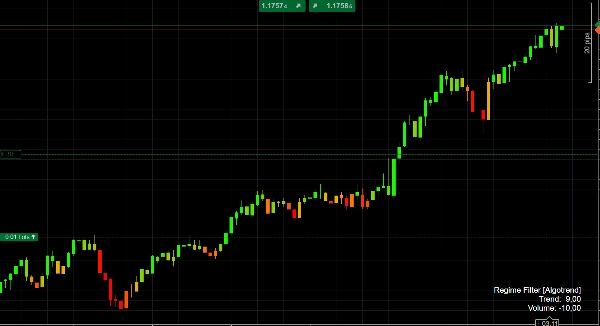
色のロジック
- トレンドスコアがマイナス の場合、ローソク足は 赤 → オレンジ のグラデーションで色付けされ、ダウンレジームの強さに応じて変化します。
- トレンドスコアがプラス の場合、ローソク足は オレンジ → ライム で色付けされ、アップレジームが強いほど緑が強くなります。
これにより、価格の動きが 弱気、中立、または強気 であるか、そしてそのレジームが現在どれほど持続しているかを即座に視覚的に把握できます。
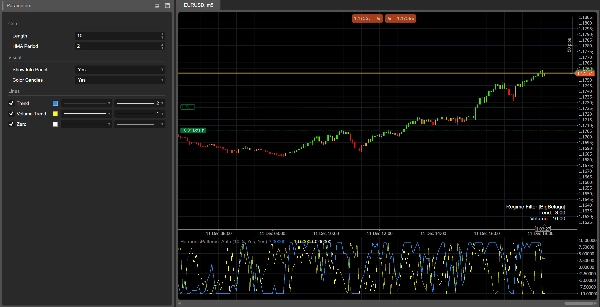
レジームパネル
サブウィンドウには、インジケーターが以下をプロットします:
- トレンドライン(青)
- 出来高トレンドライン(灰色)
- ゼロライン(基準線)
最後のバーには、現在の トレンド と 出来高 の値を表示する小さな 情報パネル が表示されます。
🎯 使い方
トレンドの確認
- 強いレジームの方向にのみ取引します。例えば:
- トレンド > +4 → ロングのみのバイアス
- トレンド < –4 → ショートのみのバイアス
レジームフィルター
- レジームが弱いとき(トレンドが0付近)や、出来高トレンドが強くマイナス のときは、戦略をオフにするか縮小してください。これはしばしば不安定またはフェードする動きを示します。
シグナルのコンテキスト
既存のエントリーシグナル(価格アクション、ハーモニックパターン、オシレーターなど)を Trend & Volume Regime Map と組み合わせて マクロフィルター として使用します:
- トレンドがプラスで出来高トレンドもプラスのときのみ ブレイクアウト を取ります。
- トレンドが非常に強いとき(> +8 または < –8)は、マーケットが強力な方向性レジームにあるため、平均回帰 のセットアップを避けます。
⚙️ 入力パラメーター
コア
Length
トレンドと出来高のスコアを構築するために使用されるバーの数。
- 値が大きいほど → より滑らかで「マクロ」なレジーム;変化は遅いが安定性が高い。
- 値が小さいほど → 反応は速いがノイズが多く、頻繁に反転する。
HMA Period
価格と出来高の両方を平滑化するために使用される Hull Moving Average の期間。
- 時間軸や取引スタイルに合わせて調整してください:短時間軸には短く、高時間軸には長く。
ビジュアル
情報パネルを表示
最後のバーに現在の トレンド と 出来高 スコアを表示する小さなテキストパネルを表示/非表示にします。ローソク足の色付け
トレンド 値(赤/オレンジ/緑のグラデーション)に基づくローソク足の色付けを有効にします。デフォルトのチャート色を維持したい場合はオフにしてください。
✅ 解釈のチートシート
- トレンド ≥ +7 → 強い強気レジーム、ローソク足は明るい緑色。
- トレンドが +3 から +7 の間 → 強気バイアス;押し目は買いの可能性があるゾーン。
- トレンドが –3 から +3 の間 → 横ばい/不安定;シグナルの信頼性は低い。
- トレンド ≤ –7 → 強い弱気レジーム、ローソク足は濃い赤色。
- 出来高トレンド > 0 → 活動が上昇/持続しており、動きは「本物」で持続的である可能性が高い。
- 出来高トレンド < 0 → 参加者が減少しており、偽の動き、もみ合い、または反転のリスクが高い。
概要
カスタマーレビュー
5 | 0 % | |
4 | 100 % | |
3 | 0 % | |
2 | 0 % | |
1 | 0 % |


![「[Hamster-Coder] Pivot Points MTF」ロゴ](https://cdn.ctrader.com/image/webp/4c143e5a-309c-40e3-a578-f04d1e133ffa_31159)
