
ElliottWave
インジケーター
198 ダウンロード数
バージョン 3.1、Jan 2026
Windows、Mac
説明
エリオット波動第3波継続&エリオット反転
エリオット波動構造 は、エリオット波動理論を用いて市場構造を分析するために設計されたインジケーターです。
これは 確定スイング分析、市場構造、エリオットインパルス検出、および専用の 第2波から第3波への継続を組み合わせています。
このツールは、主観的な描画ではなく、明確さ、確認、ルールに基づく実行を必要とするトレーダーのために作られました。
非再描画スイングエンジン
すべての計算は、確定スイングポイントに基づいて行われます:
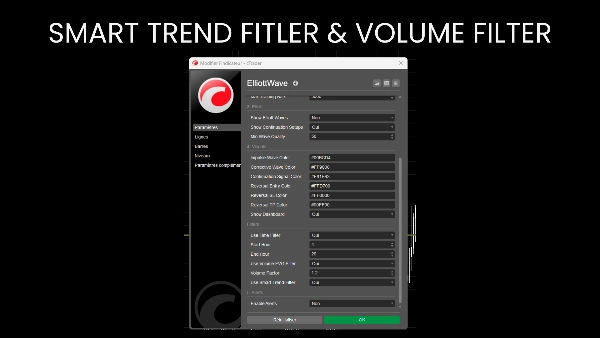
- 調整可能なスイング深度
- 最小価格変動(ピップフィルター)
- 確認バー
一度スイングが表示されると、それは動かず、完全な履歴の信頼性を保証します。
市場構造分析:
自動的に識別しラベル付けします:
- 高値更新(HH)
- 安値切り上げ(HL)
- 高値切り下げ(LH)
- 安値更新(LL)
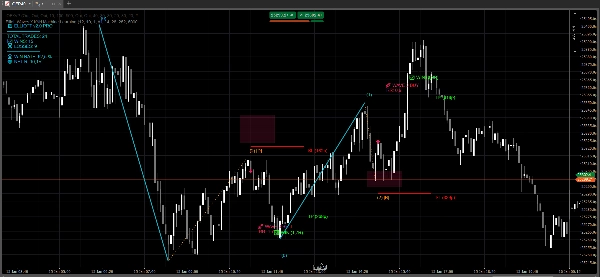
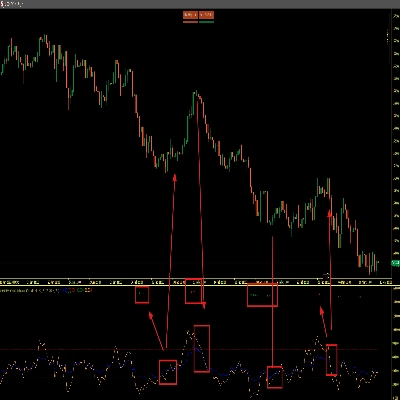
エリオット波動インパルス検出:
インジケーターは自動的に 完全な5波のエリオットインパルスを両方向で検出します:
- 強気:L-H-L-H-L-H
- 弱気:H-L-H-L-H-L
内部ルールを用いてインパルスを検証します:
- 第3波の強さ
- 第2波と第4波のリトレースメントロジック
- 第5波の比例性
各インパルスは 品質スコア(0〜100)で評価され、チャート上に直接ラベル付けされます。
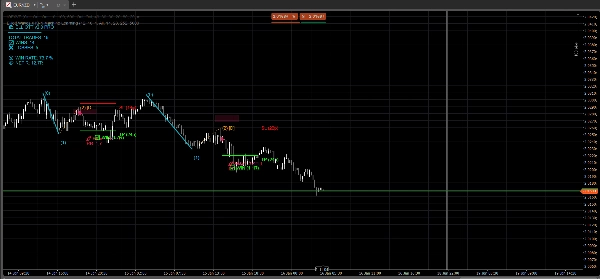
第3波継続セットアップ(主要トレーディングモジュール)
これはインジケーターのコアトレーディングコンポーネントです。
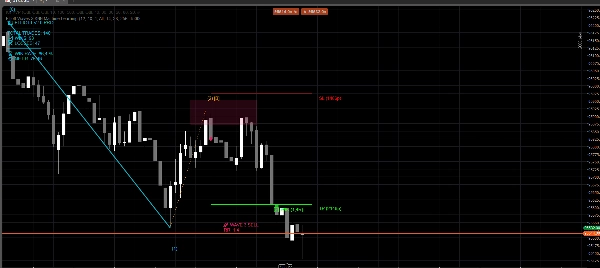
システムは 第0-1-2波の継続構造を識別し、第3波のエントリーを準備します:
- 強気:安値 → 高値 → 高値切り上げ
- 弱気:高値 → 安値 → 安値切り下げ
検証基準には以下が含まれます:
- 第2波のリトレースメントが23.6%から88.6%の間
- 第0波を通じた無効化なし
- 市場構造を用いたトレンド整合性
- ATRに対する第1波の強さ
- 価格はOB上に位置している必要があります
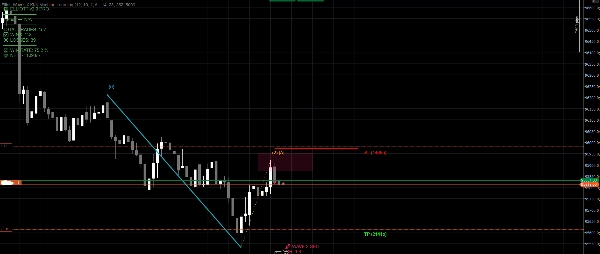
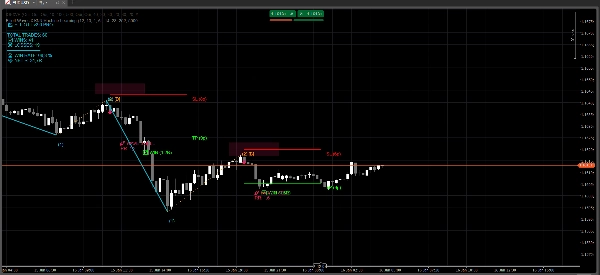
検証されると、インジケーターは自動的に以下を描画します:
- 第1波と第2波の構造
- OBエントリーゾーン
- エントリーシグナル
- 第2波を超えたATRに基づくストップロス
- ATR予測に基づくテイクプロフィット
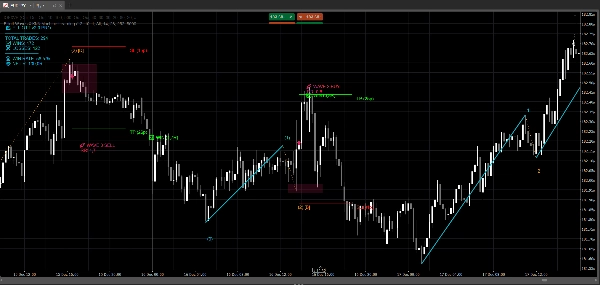
リスク&トレード管理
- ストップロスとテイクプロフィットは ATRを用いて動的に計算されます
- リスクリワード比はチャート上に直接表示されます
- 過度に伸びたまたは低品質なセットアップを避けるよう設計されています
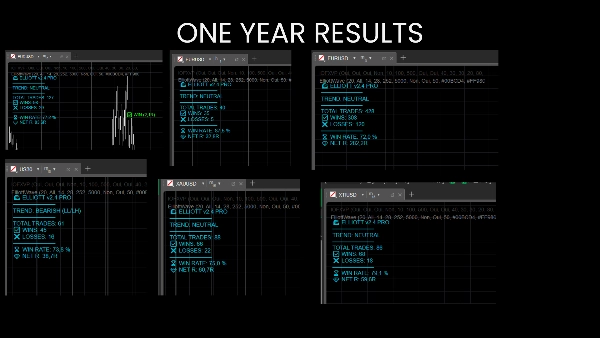
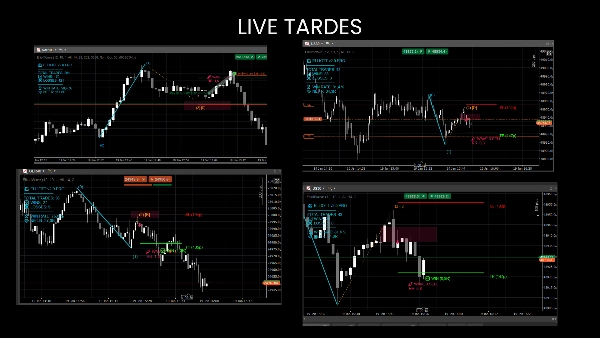
私は個人的にM1&M5のインデックススキャルピングに使用していますが、FX、商品、株式などでも機能します... ダッシュボードは特定の資産で利益が出ているかどうかを表示します。
無料版では主要なFX M15で試すことができます。
概要
インジケーターのプロフィール
カスタマーレビュー
0.0
レビュー: 0
カスタマーレビュー
この商品にはまだレビューがありません。お使いになったことがある方は、ぜひレビューをお願いします。
ディスカッション
よくあるご質問
Prop
Forex
Signal
Scalping
Indices
Commodities
Crypto
Stocks
cTrader Storeで入手可能な取引ボット、インジケーター、プラグインなどの商品は、第三者の開発者が提供するものであり、情報と技術の取得のみを目的としてご利用いただけます。cTrader Storeはブローカーではなく、投資助言や個人的な推奨を行うことも、将来のパフォーマンスを保証することもありません。
これも好きかも


![「[Hamster-Coder] Moving Average MTF」ロゴ](https://cdn.ctrader.com/image/webp/b11b98b1-194d-4b8e-b00e-d611826ad159_31226)


価格
登録日 23/07/2025
6.91M
取引数量
27.63K
獲得pips
877
無料インストール