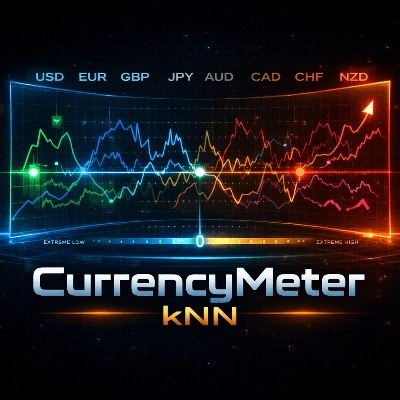
Currency Meter KNN
インジケーター
バージョン 2.0、Jan 2026
Windows、Mac
説明
CurrencyMeter kNNは、通貨の流れをすっきりと把握したいトレーダー向けに作られたマルチ通貨強度メーターであり、平均回帰確率を推定するシンプルな機械学習レイヤーを備えています。
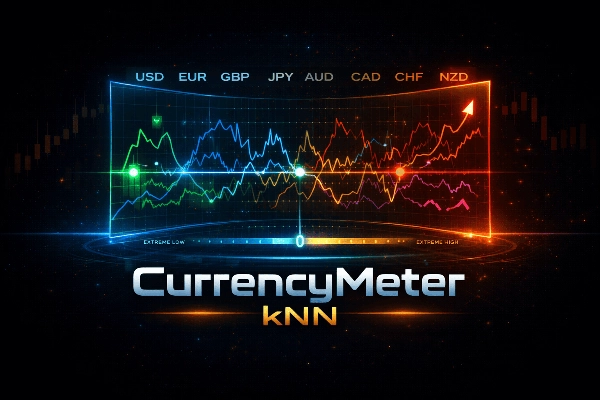
従来の指標とは異なり、8つの主要通貨(USD、EUR、GBP、JPY、AUD、CAD、CHF、NZD)の強度をすべてのペアの情報を集約して計算し、それをコンパクトなメーターに正規化します。複数のローリング期間にわたる%リターンなどのカスタム特徴量(その他5つは秘密にされています)を使用しています。
仕組み:
- マルチペア集約:各通貨について、メーターは複数の重複するローリングウィンドウ特徴量を集約します。これにより、通貨ごとの平均化された「通貨圧力」値が生成されます。
- 動的閾値による極値検出:市場は非定常的であり、価格やリターンの統計的特性は時間とともに変化します(ボラティリティ、流動性、マクロサイクル、セッション)。固定閾値は、一つの状態で「極端」とされるものが別の状態では通用しないため、しばしば失敗します。
この不安定性を減らすために、モデルはメーターの最近の分布から計算された動的閾値を使用します。これは、最近の絶対値の上位尾部(パーセンタイルベース)を「極端」と見なします。これにより、生の信号がより定常的な挙動に近づき、kNNによるモデリングと学習が容易になります。
- シンプルなkNNモデル(透明なML):k-最近傍法(kNN)分類器を用いて、極端な状態が定義された期間内に反転する傾向があるかどうかを推定します。
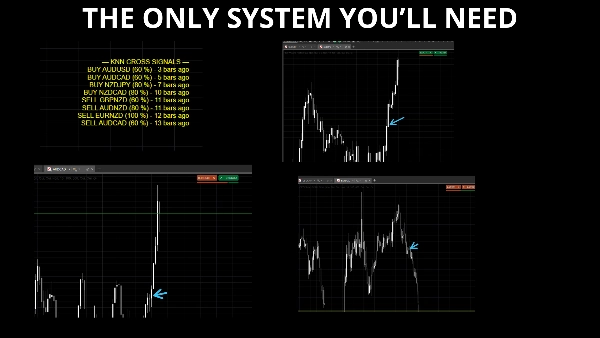
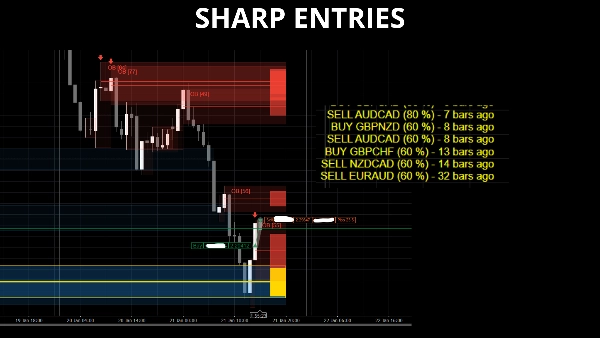
確信度閾値を超える確率がある場合、インジケーターは方向性アラートを表示します:BUY X/Y または SELL X/Y。
特徴:
- 1つのパネルに表示される8つの主要通貨
- マルチペア集約
- 最近の分布に基づく動的な「極端」閾値
- 平均回帰バイアスのためのkNN確率レイヤー
- 最近のシグナルのためのパネル上の持続的な矢印
注意事項:
- これは意図的にシンプルで透明なMLアプローチ(kNN)です。ブラックボックスではありません。
- 目的は「予測」ではなく(小売トレーダーにとっては定義上不可能)、反応です:通貨が自身の最近の挙動に対して統計的に伸びすぎている時を特定します。
概要
インジケーターのプロフィール
カスタマーレビュー
0.0
レビュー: 0
カスタマーレビュー
この商品にはまだレビューがありません。お使いになったことがある方は、ぜひレビューをお願いします。
ディスカッション
よくあるご質問
Forex
Signal
Scalping
EURUSD
GBPUSD
NZDUSD
SMC
AI
USDJPY
cTrader Storeで入手可能な取引ボット、インジケーター、プラグインなどの商品は、第三者の開発者が提供するものであり、情報と技術の取得のみを目的としてご利用いただけます。cTrader Storeはブローカーではなく、投資助言や個人的な推奨を行うことも、将来のパフォーマンスを保証することもありません。


![「[Stellar Strategies] MARSI Signal Plotter」ロゴ](https://cdn.ctrader.com/image/webp/7b2b8da6-8f8e-4646-8d4a-4710c516c01e_25567)

価格
登録日 23/07/2025
6.91M
取引数量
27.63K
獲得pips
877
無料インストール