
説明
それが何をするか
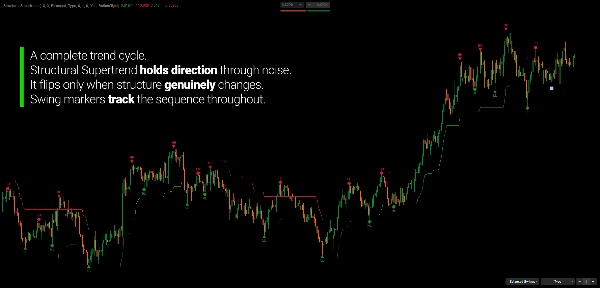
Structural Supertrendは、クラシックなSupertrendの根本的な制限に対処します:価格がバンドを超えてクローズした瞬間に方向を反転させる点です。
クリーントレンドでは、それはうまく機能します。変動が激しいまたは乱高下する状況では、単一のアグレッシブなローソク足が反転を引き起こすことがあります — たとえ広範なトレンドが構造的に維持されていても。結果として、鞭打ち現象、早期の退出、そして悪い価格での再エントリーが発生します。
このインジケーターは異なる前提に基づいて構築されています。
方向の変化は、価格が一時的に閾値を超えてクローズするだけでなく、本物の構造的変化を確認したときにのみ起こります。結果として、誤った反転が減り、トレンドの実際の発展とより良く一致します。
Supertrendは構造的になります。シグナルは意味を持ちます。
なぜStructural Supertrendなのか?
問題点
元のSupertrendは、バンドを超えたすべてのクローズを反転と見なします。これは意図的であり、インジケーターを反応的に設計しています。しかし、反応性には代償があります。
統合フェーズ中、価格は頻繁に一方のバンドを超えてクローズし、その後すぐに反転します。これらはそれぞれ反転シグナルを生成し、それぞれが潜在的な取引決定を表し、不要なポジションからの退出を意味します。
Supertrendを長く使っているトレーダーはこのフラストレーションをよく知っています。
解決策
Structural Supertrendは元のモデルを拡張し、ボラティリティによるクローズと本物の方向変化を区別します。トレンド方向を変える前に構造的な確認を要求することでノイズを除去します。
反転が減り、トレンドとの整合性が向上し、個々のローソク足に対する反応が少なくなります。
なぜ両方を保持するのか?
元のSupertrendはチャート上に表示されますが、Structuralと異なる部分のみです。この設計は意図的です。
- Structural は主要なトレンド方向を追跡します
- Original はそのトレンド内のインパルスと修正の動きを明らかにします
両者が一致するとき:強い方向性の確信。両者が異なるとき:動きは修正的であり、真の反転ではない可能性が高い。この二層の視点は、どちらのライン単独では提供できない文脈を与えます。
統合されたスイング検出
Structural Supertrendには完全なスイング検出とS/Rフレームワークが含まれています — 副次的な機能としてではなく、構造分析の直接的な拡張としてです。
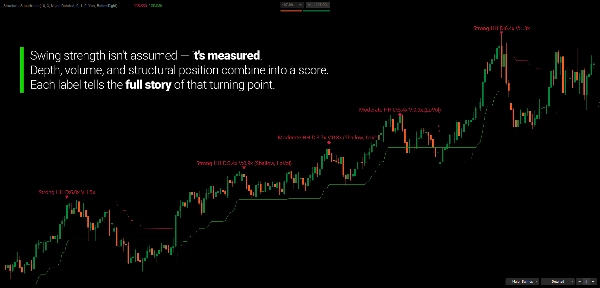
スイングは構造優先の評価プロセスを通じて識別されます:各候補は変位、出来高の確認、およびATR相対距離に対して評価され、受け入れられます。これにより、スイングマップはすべての局所的極値ではなく、意味のある転換点に焦点を当て続けます。
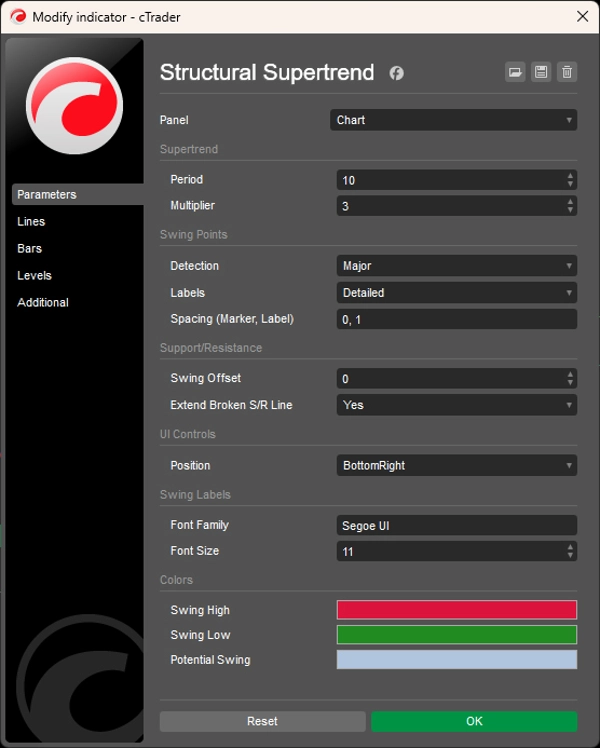
三つの検出モード
- Minor — 感度が高く、トレンド内の内側のスイングを捉えます
- Balanced — フィルタリングされた粒度、ほとんどの使用ケースに最適
- Major — より広範な基準で確認された最も強力な構造的ピボットのみ
スイング強度の分類
確認された各スイングは、深さ、出来高、および同タイプの前のスイングに対する構造的位置によってスコア付けされます。強度は最近のスイング履歴にわたるパーセンタイルランクを使用して動的に分類されます — 固定閾値ではありません。視覚的マーカーは分類を反映します:強いものは三角形、中程度はダイヤモンド、弱いものは円です。
極性追跡付きS/Rゾーン
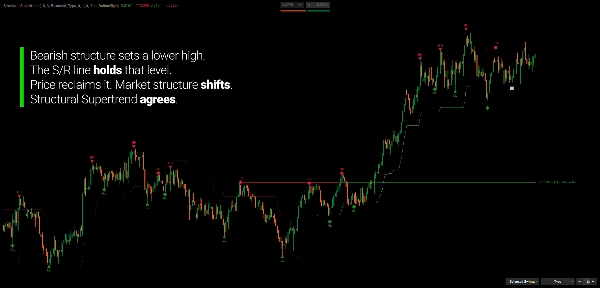
確認されたスイングは、独自の相互作用履歴を追跡するアクティブなS/Rレベルになります。価格がレベルを再訪すると、インジケーターは接触がヒゲの拒否か実体のブレイクかを記録します。レベルが掃引されてその上でクローズすると、極性が反転します — 以前の抵抗が支持に、またその逆も同様です。再度掃引されると、そのゾーンは無効になります。
年齢ラベルは各レベルがどれだけ長くアクティブであったか、そして何回テストされたかを示します。
チャートの読み方
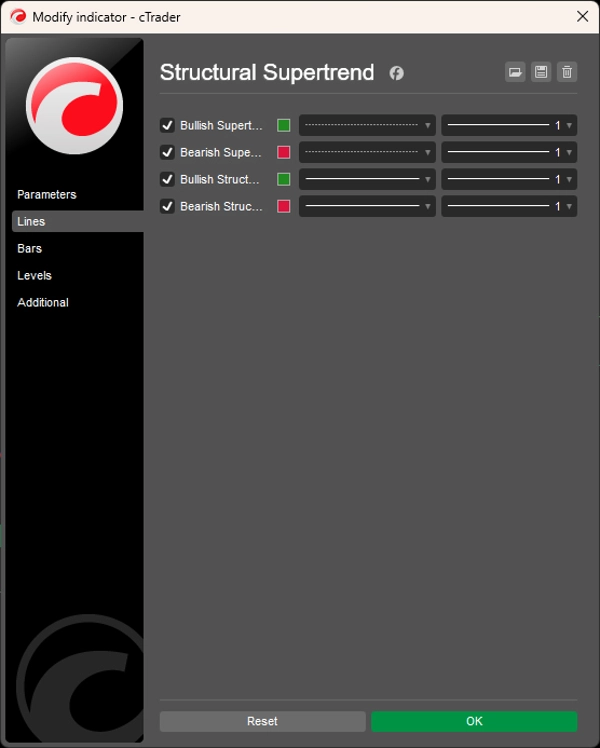
- 緑の構造線: 強気の構造的トレンド(動的サポート)
- 赤の構造線: 弱気の構造的トレンド(動的レジスタンス)
- 点線: 元のSupertrend — Structuralと異なる部分のみ表示
- S/Rライン: 極性状態と年齢を持つアクティブレベル
トレンド整合性チェック:
- 構造 + 元のSupertrendが一致 → 高い確信の方向性の動き
- 構造 + 元のSupertrendが異なる → おそらく修正的または移行段階
対象者
このインジケーターは、単一の一貫したフレームワークからトレンド方向と市場構造を読みたいトレーダー向けです。
クラシックなSupertrendを使っていて、横ばいの状況で頻繁に反転してしまうと感じたなら、Structural Supertrendはまさにそれに対応するために作られました。
これは、トレンドおよびスイングトレーダーで、絶え間ない誤反転なしによりクリーンな方向性の読みを求める方、構造ベースのトレーダーで、トレンドの健全性を検証するためにスイングの連続性を追跡する方、そして裁量トレーダーで、エントリー、エグジット、ポジション管理の文脈としてS/Rレベルを使用する方に適しています。
組み込みのUIコントロールにより、リアルタイムでの使用が実用的です:検出モードの切り替え、S/R参照の調整、ラベル詳細の切り替えをチャート上で直接行えます — 設定パネルを開く必要はありません。
これはシグナルジェネレーターではありません。これは、トレーダー向けの構造分析フレームワークであり、市場が今どこにあるかを理解したい方のためのものです。
何が違うのか
ほとんどのSupertrend実装は、バンドを超えたすべてのクローズをアクション可能と見なします。これは候補として扱い、方向転換にコミットする前に構造的証拠を要求します。
ほとんどのスイング検出器は評価基準なしに局所的な高値と安値を識別します。これは変位、出来高、構造的位置で各スイングを評価し、最近のスイング履歴に対して強度を動的にスコアリングします。
ほとんどのS/Rツールは線を引いて終わりです。これは相互作用履歴を追跡し、極性変化をフラグし、市場が各レベルを再訪するたびに進化し続けます。
結果として、より長く関連性を保ち、ノイズへの反応が少なく、市場状況のより豊かなイメージを時間とともに構築するトレンドおよび構造ツールとなっています。
---
構造分析の理解
市場構造は「正しい」スイングや「正確な」トレンド方向を見つけることではありません。価格のシーケンスがどのように発展しているか、そしてそのシーケンスが一貫しているか、または劣化し始めているかを客観的に維持することです。
トレンドは単一の動きではなく、一連の関係によって定義されます:上昇トレンドでは高値と安値が切り上がり、下降トレンドでは高値と安値が切り下がります。新しいスイングは既存のシーケンスを確認するか挑戦します。確認が続くと構造は維持され、破られると構造は移行段階に入ります。
構造分析が有用なのは、価格がどこに行くかを予測するのではなく、価格が現在そのシーケンス内のどこにあるかを記述することにあります。この違いは重要です。予測は未来に関する仮定を必要とします。構造的観察は既に起こったことの正確な読み取りだけを必要とします。
構造的ロジックに基づくインジケーターは、その観察をサポートするよう設計されており、主観的な解釈を導入せずにシーケンスを可視化し追跡可能にします。目標は現在の市場状況の明確さであり、将来の価格方向の確実性ではありません。
---
取引にはリスクが伴います。このインジケーターはテクニカル分析ツールです — 常に適切なリスク管理を適用してください。
概要
カスタマーレビュー
5 | 67 % | |
4 | 33 % | |
3 | 0 % | |
2 | 0 % | |
1 | 0 % |


![「[Stellar Strategies] MARSI Signal Plotter」ロゴ](https://cdn.ctrader.com/image/webp/7b2b8da6-8f8e-4646-8d4a-4710c516c01e_25567)


