Açıklama
FVG Göstergesi (cTrader)
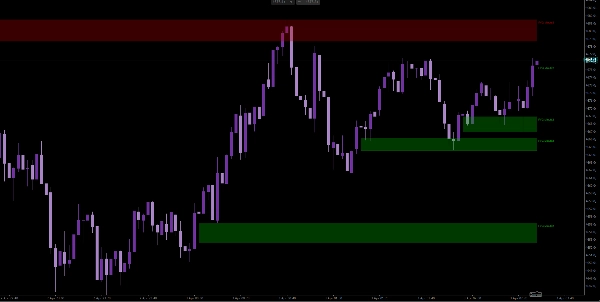
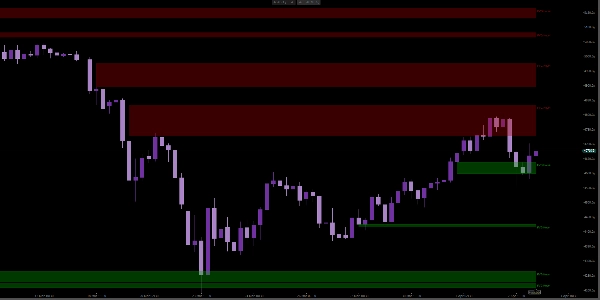
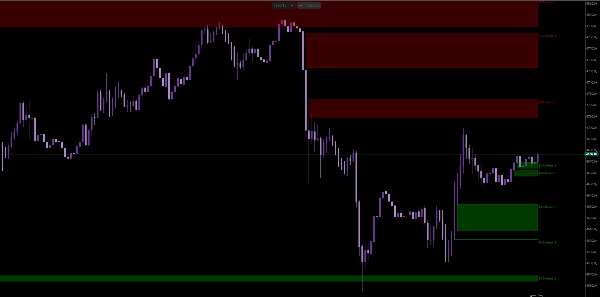
Gerçek zamanlı olarak grafik üzerinde doğrudan yükseliş ve düşüş dengesizliği bölgelerini tanımlamak ve çizmek için oluşturulmuş hassas bir Adil Değer Boşluğu (FVG) göstergesi. Fiyat hareketlerini sürekli tarar ve geçerli FVG yapıları oluşurken vurgular, bu da yürütme ve giriş iyileştirmesi için idealdir.
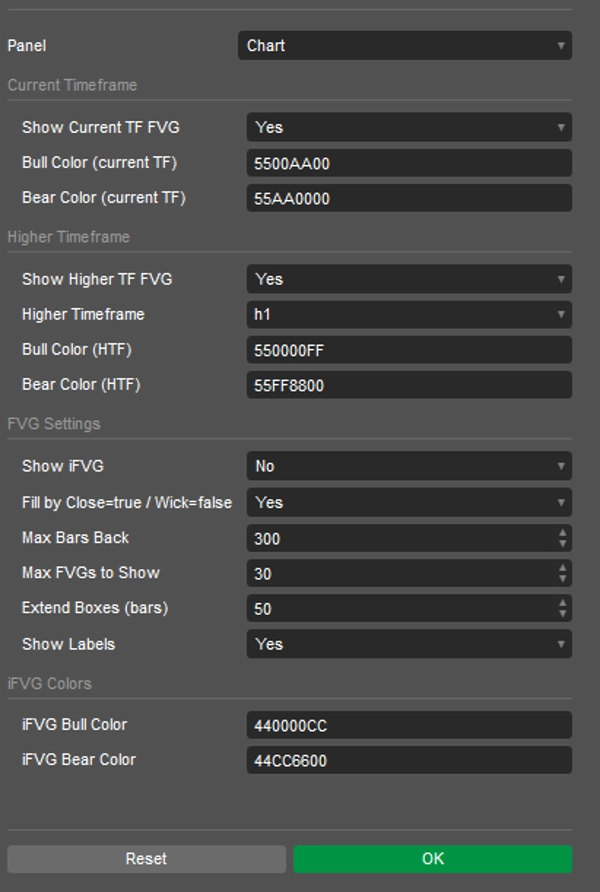
Gösterge, karmaşayı azaltmak ve üst üste binen bölgelerden kaçınmak için akıllı filtreleme uygular, sadece en alakalı boşlukların görüntülenmesini sağlar. Her FVG, özelleştirilebilir renkler ve genişletilebilir bölgelerle net bir şekilde görselleştirilir, böylece yatırımcılar zaman içinde fiyat etkileşimini takip edebilir.
Ayrıca, fiyat boşlukları giderdiğinde veya geçersiz kıldığında bölgeleri otomatik olarak güncelleyen isteğe bağlı ters FVG (iFVG) takibi içerir. Yatırımcılar, boşlukların nasıl doldurulduğunu (fitil veya kapanış) tanımlayabilir, böylece strateji tercihlerinde tam kontrol sağlar.
Açıklık, hız ve doğruluk için tasarlanmış bu araç, likidite kavramlarını, dengesizlik ticaretini ve kurumsal fiyat hareketi modellerini kullanan yatırımcılar için idealdir.