
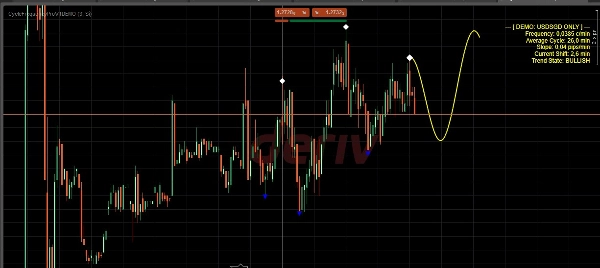
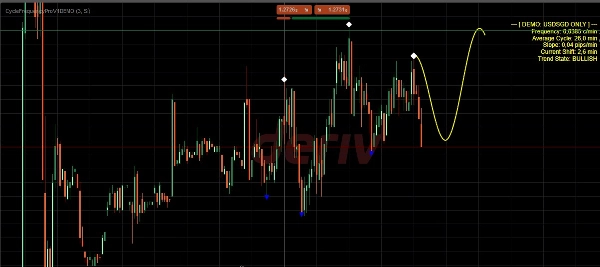
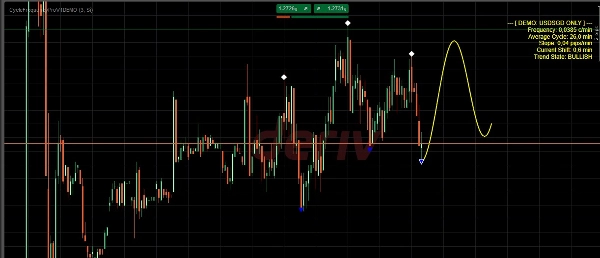
説明
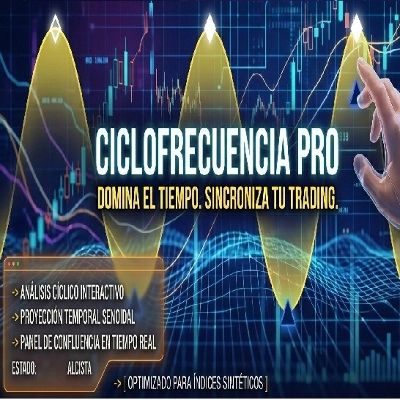
市場の周波数と取引を同期させる 遅延指標にうんざりしていますか?ほとんどのトレーダーは、市場の時間的次元を無視するために失敗します。 Cycle Frequency Pro V1 はゲームを変え、過去のサイクルとリアルタイムの周波数分析に基づいて将来の価格動向を予測できるようにします。
このインジケーターの独自性は何ですか? 自動アルゴリズムはボラティリティ時にしばしば破綻しますが、Cycle Frequency Proはあなたにコントロールを与えます。重要な構造的なピークと谷を手動で特定することで、インジケーターが正確な数学モデルに変換する「人間の優位性」を提供します。周波数、傾斜、位相シフトを即座に計算し、次の高確率の波を視覚化します。
主な特徴:
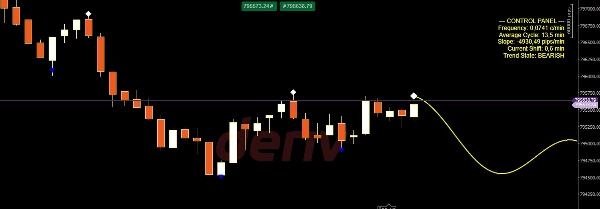
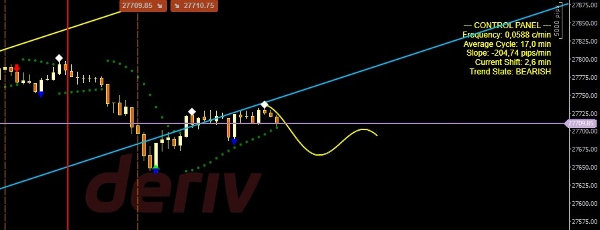
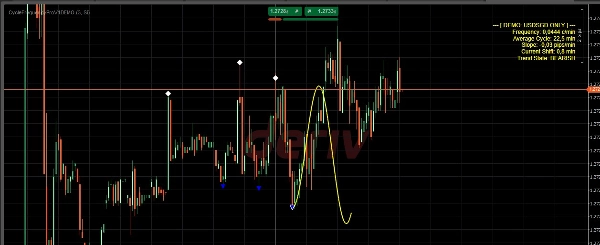
- 動的サイン波予測: 時間軸に沿った最も可能性の高い価格軌道を視覚化します。
- プロフェッショナルコントロールパネル: 周波数(c/min)、平均サイクル、ピップ傾斜などのリアルタイムデータを含みます。
- 精密ジオメトリエンジン: 超滑らかなレンダリングと頂点の精度に最適化されています。
- クロスマーケットの多用途性: 合成指数の24時間365日の流動性に特化して設計されており、Forex、商品、金属でも最高のパフォーマンスを維持します。
クイックスタート:
- ダイヤモンド(ピーク)と三角形(谷)を最新の構造的転換点に合わせます。
- 波は自動的に価格の傾斜とリズムに同期します。
- 予測された波があなたの機関ゾーンと一致する場所で取引を実行します。
概要
AIによる概要
CycleFrecuencyProV1 is a market timing indicator designed to forecast price rhythms using an interactive sine wave projection based on historical cycles and real-time frequency analysis. It enables traders to manually mark key structural peaks and valleys, which the indicator then uses to calculate frequency, slope, and phase shifts, projecting the most probable future price trajectory.
Key features include a dynamic sine wave visualization aligned with the time axis, a professional control panel displaying real-time metrics such as frequency (cycles per minute), average cycle length, and pip slope, and a precision geometric engine optimized for smooth rendering and accurate vertex placement. The indicator is engineered for versatility across multiple markets, including Synthetic Indices with 24/7 trading, Forex, Commodities, and Metals.
To use, traders align the indicator’s markers with recent structural turning points, allowing the wave to synchronize automatically with current price rhythm. This projection can then be used to identify high-probability trade entries in conjunction with institutional zones. The indicator supports visualization, signal generation for reversals, level touches, trend strength, and divergence, and requires bar or tick data for analysis. It is categorized under market structure indicators.
Key features include a dynamic sine wave visualization aligned with the time axis, a professional control panel displaying real-time metrics such as frequency (cycles per minute), average cycle length, and pip slope, and a precision geometric engine optimized for smooth rendering and accurate vertex placement. The indicator is engineered for versatility across multiple markets, including Synthetic Indices with 24/7 trading, Forex, Commodities, and Metals.
To use, traders align the indicator’s markers with recent structural turning points, allowing the wave to synchronize automatically with current price rhythm. This projection can then be used to identify high-probability trade entries in conjunction with institutional zones. The indicator supports visualization, signal generation for reversals, level touches, trend strength, and divergence, and requires bar or tick data for analysis. It is categorized under market structure indicators.
インジケーターのプロフィール
インジケーターのカテゴリー
市場構造(SMC)
出力の種類
ビジュアル表示
シグナル
フィルター
データ要件
バーのみ
ティックデータ
サポート対象のシグナル
反転
ラインタッチ
トレンドの強さ
ダイバージェンス
ディスカッション
カスタマーレビュー
5.0
レビュー: 2
5 | 100 % | |
4 | 0 % | |
3 | 0 % | |
2 | 0 % | |
1 | 0 % |
よくあるご質問
RSI
Order Block
Market Structure
Supply & Demand
Channel
Liquidity Grab
Support & Resistance
cTrader Storeで入手可能な取引ボット、インジケーター、プラグインなどの商品は、第三者の開発者が提供するものであり、情報と技術の取得のみを目的としてご利用いただけます。cTrader Storeはブローカーではなく、投資助言や個人的な推奨を行うことも、将来のパフォーマンスを保証することもありません。
この作成者の他の商品














価格
登録日 18/12/2025