

Fisher Oscillator
インジケーター
バージョン 1.0、May 2026
Windows、Mac
登録日 21/02/2025
466.3M
取引数量
180.83K
獲得pips
26
販売
7.44K
無料インストール
説明
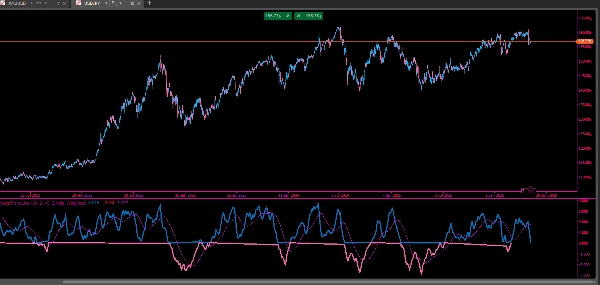
このインジケーターは、cTrader向けに設計された修正版のフィッシャー変換です。価格データを正規化されたオシレーターに変換し、市場の潜在的な転換点を強調します。
設定可能な期間の中央値価格(高値と安値の平均)に基づいて平滑化されたフィッシャー変換を計算します。この変換は極端な価格変動を強調し、トップやボトムを識別しやすくします。
ノイズを減らすために、生のフィッシャー値はさらに2つの移動平均(設定可能な期間とタイプ)を使って平滑化されます。インジケーターはまた、正のフィッシャー値と負のフィッシャー値を2つの異なる色(緑と赤)でプロットし、ゼロライン周辺の視認性を向上させます。
さらに、2番目の移動平均を使用してシグナルライン(黄色)がプロットされ、トレーダーがトレンドの方向性やモメンタムの変化をより明確に識別できるようにします。
全体として、このインジケーターは反転の検出、買われ過ぎ/売られ過ぎの状態の強調、および層状平均化によるより滑らかなトレンド確認に使用されます。
概要
AI summary
The Fisher Oscillator is a modified version of the Fisher Transform indicator designed for the cTrader platform. It converts price data into a normalized oscillator that highlights potential market turning points by emphasizing extreme price movements. The calculation is based on a smoothed Fisher Transform of the midpoint price (average of high and low) over a configurable period.
To reduce noise, the indicator applies two moving averages with customizable periods and types to smooth the raw Fisher values. It visually separates positive and negative Fisher values into green and red plots, respectively, enhancing clarity around the zero line. Additionally, a yellow signal line derived from the second moving average helps identify trend direction and momentum shifts.
This indicator is primarily used to detect market reversals, highlight overbought and oversold conditions, and provide smoother trend confirmation through layered averaging. It supports trend and market structure analysis and outputs visual signals suitable for bar-based price data.
To reduce noise, the indicator applies two moving averages with customizable periods and types to smooth the raw Fisher values. It visually separates positive and negative Fisher values into green and red plots, respectively, enhancing clarity around the zero line. Additionally, a yellow signal line derived from the second moving average helps identify trend direction and momentum shifts.
This indicator is primarily used to detect market reversals, highlight overbought and oversold conditions, and provide smoother trend confirmation through layered averaging. It supports trend and market structure analysis and outputs visual signals suitable for bar-based price data.
インジケーターのプロフィール
インジケーターのカテゴリー
トレンド
出力の種類
ビジュアル表示
データ要件
バーのみ
サポート対象のシグナル
トレンドの強さ
反転
カスタマーレビュー
0.0
レビュー: 0
カスタマーレビュー
この商品にはまだレビューがありません。お使いになったことがある方は、ぜひレビューをお願いします。
ディスカッション
よくあるご質問
EMA
Market Structure
Moving Average
cTrader Storeで入手可能な取引ボット、インジケーター、プラグインなどの商品は、第三者の開発者が提供するものであり、情報と技術の取得のみを目的としてご利用いただけます。cTrader Storeはブローカーではなく、投資助言や個人的な推奨を行うことも、将来のパフォーマンスを保証することもありません。



















![「[Stellar Strategies] MARSI Signal Plotter」ロゴ](https://cdn.ctrader.com/image/webp/7b2b8da6-8f8e-4646-8d4a-4710c516c01e_25567)







価格
登録日 21/02/2025
466.3M
取引数量
180.83K
獲得pips
26
販売
7.44K
無料インストール