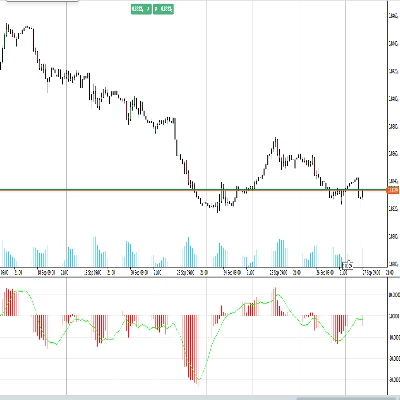
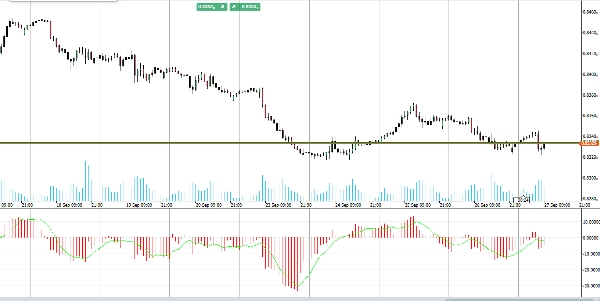


Introducing the Time Segmented Volume (TSV) indicator, designed to enhance your trading strategy with deeper insights into volume flow and price trends.
The TSV indicator measures the relationship between price and volume over a specified time period, helping you identify accumulation and distribution phases in the market.
Identify used to identify trends in stock prices, pinpoint support and resistance levels, and decode trading signals.
Perfect for traders seeking to refine their analysis and improve their decision-making, the TSV indicator offers a powerful tool for understanding market dynamics.
Upgrade your trading toolkit with the Time Segmented Volume indicator for superior trading performance.
この作成者の他の商品
インジケーター
macd
RT MACD
Customize the MACD! Choose colors, get real-time tick updates, and see crossover points for enhanced trading precision.
インジケーター
atr
RT Chandelier Exit
Optimize exits with Chandelier Exit! Visualize stop-loss points dynamically for improved trading precision and safety.
インジケーター
vwap
RT VWAP
Unlock VWAP in cTrader! Choose anchor periods, price sources, and display deviation bands with real-time tick updates.
インジケーター
breakout
RT Consolidation Zones
Identify and trade breakouts with Consolidation Zones! Visualize price consolidation areas for trading opportunities.
インジケーター
atr
RT TradingView ATR
Upgrade to ATR-RMA! Experience the precise ATR using Relative Moving Average for accurate volatility analysis in cTrader
インジケーター
indices
RT True Strength Index
Enhance trading with TSI! Use the True Strength Index for clear insights into market momentum and trend strength.
インジケーター
rsi
RT Stochastic RSI PRO
Unlock Stochastic RSI PRO in cTrader! Overlay RSI, highlight zones, and identify divergences with customizable settings.
インジケーター
breakout
RT Standard Deviation Channel_noSourceCode
Visualize trends with Standard Deviation Channel! Display median, and add customizable upper/lower deviation channels.
インジケーター
bollinger
RT Qualitative Quantity Estimation
Unlock trading precision with QQE! Dual QQE indicators with a Bollinger Bands zero line provide clear buy/sell signals.
インジケーター
macd
RT MACD Histogram
Enhance MACD Histogram! Visualize bull and bear price changes with vibrant colors for clearer, more insightful trading.
これも好きかも
インジケーター
breakout
RT Consolidation Zones
Identify and trade breakouts with Consolidation Zones! Visualize price consolidation areas for trading opportunities.
インジケーター
indices
RT True Strength Index
Enhance trading with TSI! Use the True Strength Index for clear insights into market momentum and trend strength.
トップ評価
インジケーター
macd
IR Macd + MacdLine
some user add moving average to macd to see better. in ctrader 4.3.11 there is a problem with this . I make a macd tha
インジケーター
bollinger
E7 Indicators Free Studies
ADXR, KDJ, SineWave, Bollinger Band Volatility and AEOscillator.