Insider_CumulativeDelta
インジケーター
820 ダウンロード数
バージョン 1.0、Apr 2025
Windows、Mac
5.0
レビュー: 1
説明
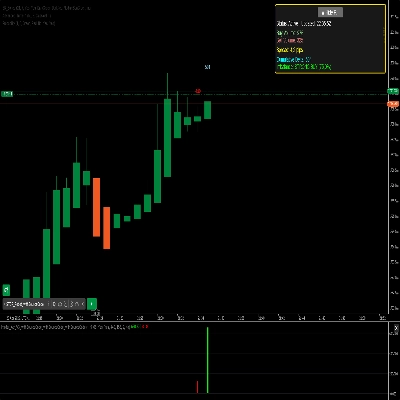
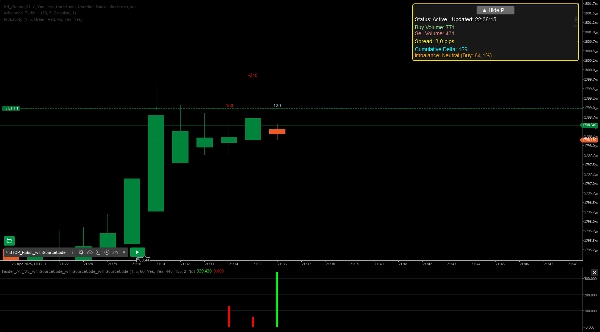
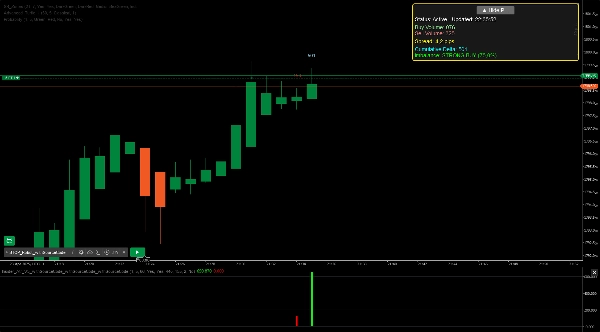
堅牢な累積デルタおよびアンバランス指標。
Insiderは、市場の深さデータを分析し、リアルタイムで買いと売りのアンバランスを強調表示するために設計された堅牢なcTraderインジケーターです。チャート上に明確な視覚的フィードバックを提供し、買い/売りのボリューム、累積デルタ、アンバランスの強さなどの主要な指標をヒストグラムやカスタマイズ可能なダッシュボードを通じて表示します。表示期間、深さレベル(1〜10)、ボリュームアンバランスの閾値(50〜95%)などの調整可能な設定で、あなたの取引スタイルに合わせてカスタマイズできます。その他の機能には、強いアンバランスに対するオプションのアラート、取引時間のフィルタリング、使いやすさを向上させるリサイズ可能なパネルが含まれます。デイトレーダーやスイングトレーダーに最適で、市場のセンチメントや潜在的な価格変動に関する貴重な洞察を提供します。
概要
AIによる概要
Insider_CumulativeDelta is a cTrader indicator that analyzes market depth data to identify buy and sell imbalances in real time. It visually presents key metrics such as buy/sell volume, cumulative delta, and imbalance strength using histograms and a customizable dashboard directly on the trading chart. Users can adjust settings including display period, depth levels (1 to 10), and volume imbalance thresholds (50% to 95%) to suit their trading preferences. Additional features include optional alerts for significant imbalances, filtering by trading hours, and a resizable panel for improved usability. This indicator is designed to support day traders and swing traders by providing insights into market sentiment and potential price movements.
インジケーターのプロフィール
カスタマーレビュー
5.0
レビュー: 1
5 | 100 % | |
4 | 0 % | |
3 | 0 % | |
2 | 0 % | |
1 | 0 % |
カスタマーレビュー
August 12, 2025
Pros: Accurate order flow insight, customizable display, valuable for intraday trading. Cons: No alerts, requires experience to interpret, no MTF mode.
ディスカッション
よくあるご質問
cTrader Storeで入手可能な取引ボット、インジケーター、プラグインなどの商品は、第三者の開発者が提供するものであり、情報と技術の取得のみを目的としてご利用いただけます。cTrader Storeはブローカーではなく、投資助言や個人的な推奨を行うことも、将来のパフォーマンスを保証することもありません。


価格
登録日 09/01/2025
11.78K
無料インストール