VWAP-Free
مؤشر
1.69K التنزيلات
الإصدار 1.0، Jul 2025
Windows, Mac
5.0
التقييمات: 2
الوصف
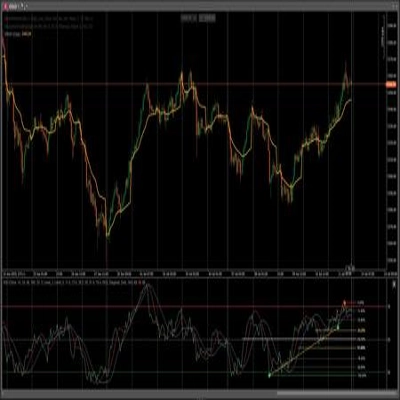
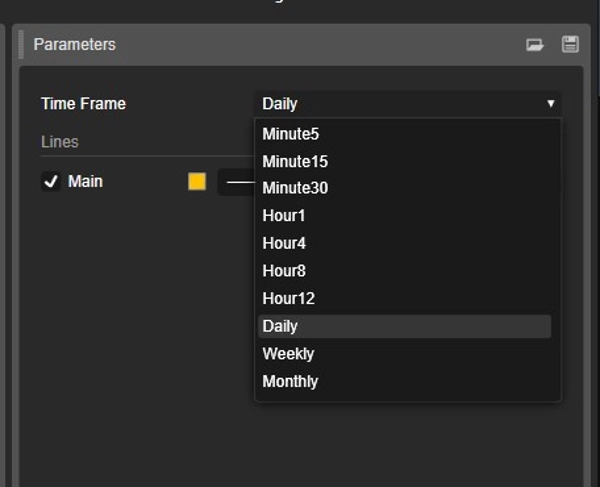
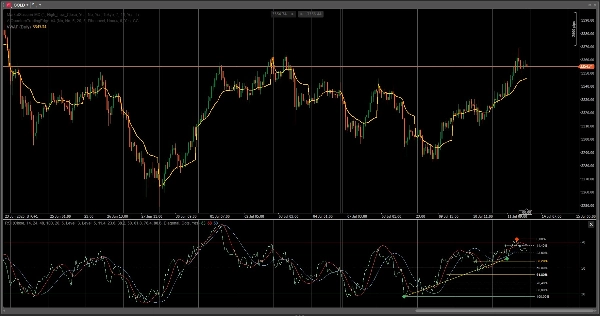
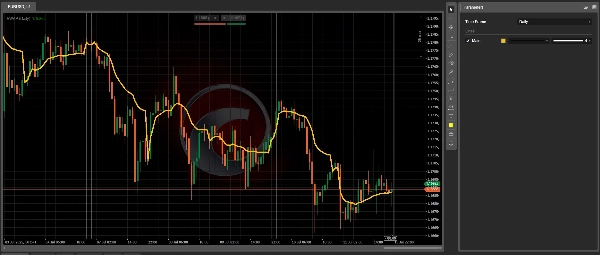
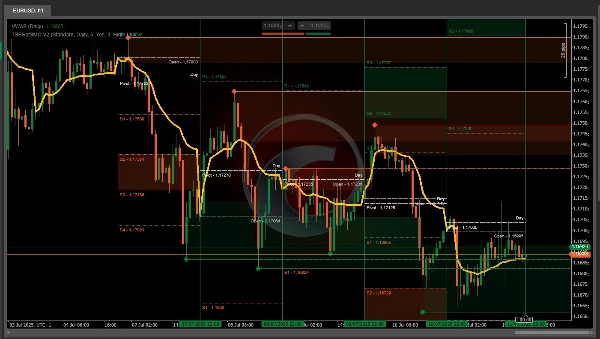
الإطار الزمني لـ VWAP فقط لا أكثر.
الملخص
ملخص الذكاء الاصطناعي
VWAP-Free is a technical indicator focused exclusively on the Volume Weighted Average Price (VWAP) for a single timeframe. It provides traders with a clear VWAP calculation without additional features or complexity. This tool is designed to simplify analysis by presenting only the VWAP data, aiding in understanding price trends relative to volume over the chosen timeframe. It is categorized under volume-based indicators and supports integration within trading platforms that utilize such indicators.
ملف تعريف المؤشر
تقييمات العملاء
5.0
التقييمات: 2
5 | 100 % | |
4 | 0 % | |
3 | 0 % | |
2 | 0 % | |
1 | 0 % |
تقييمات العملاء
December 5, 2025
Thank you Mr. Thomas Sparrow , finally could put it to work , thank you for sharing
December 5, 2025
Thank You Mr.Thomas Sparrow , i could see where i did wrong , thank you for sharing this wonderfull tool
مناقشة
الأسئلة الشائعة
VWAP
يتم توفير المنتجات المتاحة من خلال cTrader Store، بما في ذلك روبوتات التداول والمؤشرات والإضافات، من قبل مطوري الطرف الثالث وإتاحتها لأغراض الوصول المعلوماتي والفني فقط. cTrader Store ليس وسيطًا ولا يقدم نصائح استثمارية أو توصيات شخصية أو أي ضمان للأداء المستقبلي.


![شعار "[CB] Pivot Points Pro"](https://cdn.ctrader.com/image/webp/43463c82-67b0-4f10-a4ba-901bba091d81_32594)


السعر
147
المبيعات
11.17K
التثبيتات المجانية