Dhruvin Wick Candelssss
지표
75 다운로드
버전 1.0, Jul 2025
Windows, Mac
가입일 30/07/2025
75
무료 설치

설명

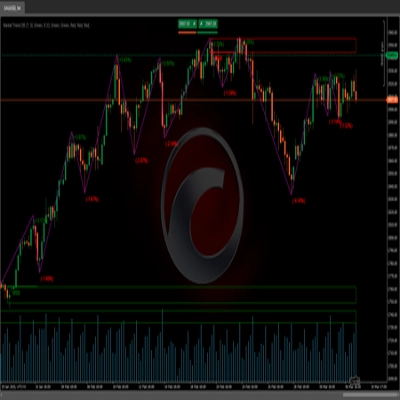
RSI 스캘핑 cBot은 마이크로 스캘핑을 위한 올인원 솔루션입니다. RSI 추세를 모니터링하고, 변동성이 큰 상품에서 즉시 거래를 실행하며, 정밀하게 출구를 확보합니다. 복잡한 설정 없이 위험만 설정하면 완벽하게 작동하는 모습을 지켜볼 수 있습니다.


요약

AI 요약
Dhruvin Wick Candelssss is an RSI-based scalping indicator designed for high-volatility trading environments. It operates by monitoring Relative Strength Index (RSI) trends to identify micro-scalping opportunities on choppy instruments. The tool automates trade execution and exit management, aiming to secure precise exits without requiring advanced user setup. Users need only configure their risk parameters for the indicator to function. This product supports rapid, short-term trading strategies focused on capturing small price movements.
지표 프로필

고객 리뷰

0.0
리뷰: 0
고객 리뷰
이 상품에 대한 리뷰가 아직 없습니다. 이미 사용해 보셨나요? 다른 사람들에게 가장 먼저 소개해 주세요!

상담

자주 묻는 질문(FAQ)

트레이딩 봇, 지표, 플러그인 등 cTrader Store에서 제공되는 상품은 제3자 개발자에 의해 제공되며, 이는 단순히 정보 및 기술적 접근을 목적으로 제공된 것입니다. cTrader Store는 중개인이 아니며, 투자 조언, 개인별 추천 또는 향후 성과에 대한 어떠한 보장도 제공하지 않습니다.

좋아하실 만한 다른 항목

+5
Tracks NY, London, Tokyo, Sydney sessions with custom visuals, and a real-time expanding range box and breakout High/Low
+5
An institutional-grade trading system fusing triple hybrid moving averages, multi-oscillator momentum filters, Fair Valu
+6
UT Bot Alerts Nova: Advanced trend-following indicator using ATR for signals. Precise entries/exits.
+2
Compact premium cTrader dashboard for market bias, sessions, premium/discount context, liquidity direction, ADR range an
Proprietary trading desk risk monitoring dashboard!
+5
One of the best indicators we have ever developed, with a very high profit ratio.
+1
Customizable cTrader indicator for marking trading sessions with vertical lines.
+7
Visual tool tracking financial assets' % performance across timeframes, highlighting trends with color-coded insights.
+3
Day of Week Indicator for cTrader
+15
Session-based range tool projecting adaptive Gann & Fib levels with auto bias flip and extensions.
The Break of Structure (BoSCHoCh) Indicator is a smart market structure tool designed to help traders easily spot trend.
3 bar triangle = high below 2 day high, low above 2 day low
+5
Daily/Weekly/Monthly - Highs & Lows Indicator (Customizable Settings)
+4
Session & Kill Zone Highlighter - Visual tool for London, NY, Tokyo, Sydney sessions plus ICT Kill Zones.
+2
HTF POWER 3 ICT Power of 3 · M1 Precision · H4 Intelligence Auto-detect Accumulation → Manipulation → Distribution
+3
Visual market context dashboard showing bias states, CE positioning, session status and sweep context.
+11
🌊 See when the market is truly in play. Tsunami measures Relative Volume by time-of-day 🌊
+3
Advanced indicator to highlight key execution context and help aligning structure, location, and risk.

가격

가입일 30/07/2025
75
무료 설치