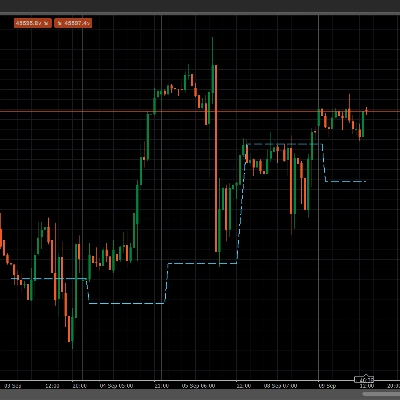
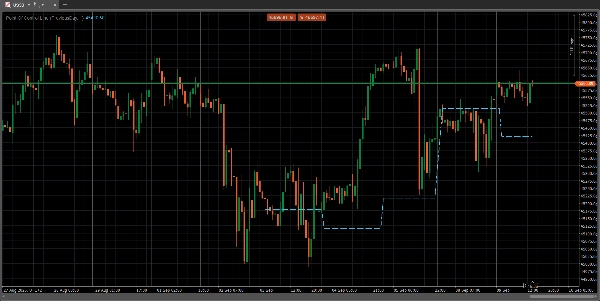
"POC Line lookback" logosu
POC Line lookback
"POC Line lookback" yüklenen resmi
Başlangıç 21/04/2025

The Point of Control is a price level on a volume profile chart where the most trading volume has been conducted within a specified period. This level acts as a significant support or resistance zone because it represents a price where large trading institutions were most active and where market price found consensus. Traders use the line to identify key price zones, gauge market sentiment, and anticipate potential price movements and reversals

Indicator profile
0.0
Değerlendirmeler: 0
Müşteri değerlendirmeleri
Bu ürün için henüz bir değerlendirme yok. Ürünü denediniz mi? O zaman ona dair görüşlerini paylaşan ilk kişi olun!
Forex
Indices
Products available through cTrader Store, including trading bots, indicators and plugins, are provided by third-party developers and made available for informational and technical access purposes only. cTrader Store is not a broker and does not provide investment advice, personal recommendations or any guarantee of future performance.

Bu oluşturanın diğer ürünleri

Displays the POC line for previous sessions in an easy to see manner.

Şunları da beğenebilirsiniz

Woodie_CCI_pro is an advanced CCI-based toolkit built around the classic Woodie CCI methodology.
Customizable cTrader indicator for marking trading sessions with vertical lines.
Track the Movement of Market Assets with an Oscillator Scanner in Real-Time!
Detects Head & Shoulders patterns, plots signals, and alerts for trading opportunities.
Linear regression line with deviation-based upper/lower channels for trend and reversal analysis.
Advanced MA crossover indicator. All MA types supported. Clear signals with customizable arrows Perfect for all trader
Volumen Delta", es una representación visual del flujo de órdenes basada en el volumen de transacciones.
Single-line JPY Strength Indicator: Track yen momentum swiftly across key pairs—achieve clarity in your forex trades!
Market structural patterns , specifically the concepts of Change of Character (ChoCH) 🔄 and Break of Structure (BoS) 💥
Key NY session opens for NASDAQ (US100) & SP500 to find Tick Precise Entrys for High R:R intraday setups.
ATR Band Channel – Spot high-probability reversals when price snaps back inside dynamic ATR bands. Built for precision.
ALMA Smoothed Gaussian Moving Average (ASGMA) – by LudwigICT
Order Block Detector is built to spot and display Order Blocks on chart, often triggering strong price reactions.
ATR-based SL and TP1/2/3 levels with pip labels and R-multiples. Essential risk tool for FTMO and prop firm traders.
ZLEMA (Zero Lag EMA) is a faster, smoother version of EMA, ideal for capturing quick market shifts and trends.
Rolling VWAP with dynamic or fixed time window, customizable source price and standard deviation bands.
"Follow Line" logosu
4.5
(4)
Ücretsiz
The Follow Line Indicator is a versatile tool designed to identify market trends and provide accurate buy/sell signals.
Başlangıç 21/04/2025