
설명
바운티 킬라 – 큰 플레이어들보다 먼저 스톱로스 유동성을 사냥하는 지표.
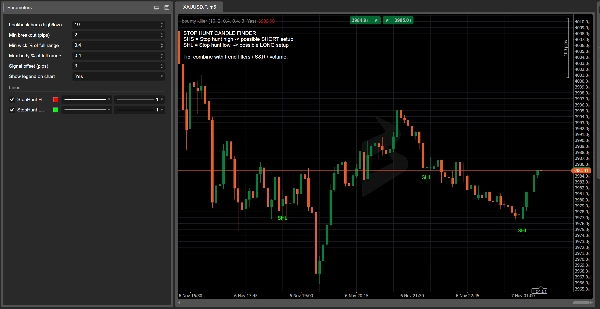
바운티 킬라는 스톱 헌트 / 유동성 확보를 좋아하는 트레이더를 위해 설계된 cTrader 지표입니다: 고점 위나 저점 아래로 급등하는 캔들로, 스톱을 청소한 후 반대 방향으로 되돌아갑니다.
이 지표는 모든 캔들을 자동으로 스캔하고 다음을 표시합니다:
- SHS (스톱 헌트 하이) – 최근 고점 위에서 발생할 가능성이 있는 스톱 헌트 → 숏 셋업을 찾을 영역
- SHL (스톱 헌트 로우) – 최근 저점 아래에서 발생할 가능성이 있는 스톱 헌트 → 롱 셋업을 찾을 영역
탐지 로직은 다음을 기반으로 합니다:
- 최근 고점/저점을 최소 X 핍 이상 돌파,
- 그 수준을 넘어선 긴 꼬리,
- 작은 몸통과 돌파와 반대 방향으로 마감.
“아마도 이게 스톱 헌트였을 거야”라는 추측은 이제 그만: 바운티 킬러는 차트 위에 핵심 캔들을 명확한 라벨, 색상, 차트 내 범례와 함께 직접 표시합니다.
트레이더들이 좋아하는 이유:
- 시장 어디서 유동성을 확보했는지와 반전이 더 의미 있어지는 지점을 보여줍니다.
- 완전히 사용자 설정 가능: 조회 창, 최소 돌파 핍 수, 몸통/꼬리 비율, 신호 오프셋 등.
- 클래식한 지지/저항, 공급 & 수요, 거래량, 주문 블록 및 SMC 개념과 완벽히 결합됩니다.
- 유동성 기반 셋업을 따르는 트레이더에게 훌륭하며, 순수한 눈대중 대신 객관적이고 규칙 기반인 것을 원할 때 적합합니다.
⚠️ 바운티 킬라는 완전한 거래 시스템이 아니며 거래를 열거나 닫지 않습니다.
표시된 캔들은 높은 정보량을 가진 구역으로, 자신의 전략, 추세 분석 및 리스크 관리와 통합해야 합니다.
바운티 킬라 – 빠른 사용자 가이드 (EN)
1. 추천 시장 및 시간대
- 시간대: H1, H4, D1
(M1–M5 같은 낮은 TF는 노이즈가 많아 주로 학습용으로 사용하세요.) - 심볼: 지수, FX, 암호화폐, 주식, 원자재 – cTrader 지표를 붙일 수 있는 모든 곳.
2. 신호 읽는 방법
- SHS – 스톱 헌트 하이 (캔들 위 빨간 라벨)
-
- 가격이 최근 고점 위로 급등하고, 긴 윗꼬리를 만들며, 약세로 마감합니다.
- 아이디어: 가짜 돌파와 고점 위 유동성 확보 후 잠재적 숏 셋업.
- SHL – 스톱 헌트 로우 (캔들 아래 초록 라벨)
-
- 가격이 최근 저점 아래로 급락하고, 긴 아랫꼬리를 만들며, 강세로 마감합니다.
- 아이디어: 가짜 하락 돌파와 저점 아래 유동성 확보 후 잠재적 롱 셋업.
바운티 킬러는 “지금 매수/매도”라고 말하지 않습니다.
반전이 더 의미 있는 유동성 구역을 강조합니다.
3. 제안 기본 설정
지표 매개변수에서:
- 조회 바 (고점/저점):
10–20
→ 최근 고점/저점을 찾기 위해 얼마나 많은 바를 되돌아볼지. - 최소 돌파 (핍):
5–15핍
→ 스톱 헌트로 간주하기 위한 고점/저점 돌파 최소 거리. - 전체 범위 대비 최소 꼬리 %:
0.60–0.70
→ 캔들의 최소 60–70%가 스톱 헌트 방향의 꼬리여야 함. - 전체 범위 대비 최대 몸통 %:
0.25–0.35
→ 전체 캔들 범위에 비해 작은 몸통. - 신호 오프셋 (핍):
3–5
→ 시각적 용도로, SHS/SHL 라벨을 캔들에서 약간 떨어뜨림.
4. 간단한 예제 전략
추세 필터 (EMA 200):
- 차트에 200 EMA 추가.
- 숏 전용:
-
- 가격이 EMA 200 아래에 있음
- SHS 신호(스톱 헌트 하이)를 받음.
- 롱 전용:
-
- 가격이 EMA 200 위에 있음
- SHL 신호(스톱 헌트 로우)를 받음.
진입 아이디어:
- 스톱 헌트 캔들이 마감될 때까지 기다림.
- 다음 캔들에서 가격이 확인될 경우에만 진입:
-
- SHS의 경우: 다음 캔들이 SHS 캔들의 저점을 깨면 → 숏 고려.
- SHL의 경우: 다음 캔들이 SHL 캔들의 고점을 깨면 → 롱 고려.
스톱 로스:
- SHS (숏)의 경우 → SL은 SHS 캔들의 고점 바로 위에 설정.
- SHL (롱)의 경우 → SL은 SHL 캔들의 저점 바로 아래에 설정.
이익 실현:
- 최소 1:1.5 또는 1:2 R/R 목표, 또는
- 근처의 스윙 고점/저점, 지지/저항 또는 공급/수요 구역을 목표로 사용.
5. 안전 주의사항 및 빠른 체크리스트
바운티 킬러 신호를 사용하기 전에 다음을 확인하세요:
- 추세?
신호가 전체 추세(EMA 200 / 시장 구조)와 일치하는가? - 레벨?
스톱 헌트가 의미 있는 레벨(이전 고점/저점, S/R, 세션 고점/저점 등)에서 발생하는가? - 상황?
뉴스, 세션 시작/종료, 변동성 급증 등이 있는가? - 리스크?
거래당 최대 % 등 자금 관리에 맞는 스톱 크기인가?
이 중 3–4가지가 맞으면, 바운티 킬라의 SHS/SHL은 단순한 “멋진 캔들”이 아니라 높은 가치의 구역으로 거래 아이디어를 구축할 수 있습니다.
요약
The detection criteria include a breakout beyond recent highs/lows by a configurable number of pips, a long wick extending beyond that level, a small candle body, and a close opposite to the breakout direction. Signals are displayed directly on the chart with clear labels and colors, supported by an on-chart legend.
Recommended for use on hourly to daily timeframes (H1, H4, D1) across various markets including forex, indices, cryptocurrencies, stocks, and commodities, Bounty Killa is fully customizable with parameters such as lookback period, minimum breakout size, wick and body proportions, and signal label offset.
The indicator highlights high-value liquidity zones to support trading decisions but does not execute trades. It is intended to be combined with other analysis tools like support/resistance, volume, order blocks, and trend filters (e.g., 200 EMA) for developing objective, rule-based liquidity-based trading setups.
고객 리뷰
5 | 50 % | |
4 | 50 % | |
3 | 0 % | |
2 | 0 % | |
1 | 0 % |


