
Açıklama
Çoklu Zaman Dilimi Trend Tarayıcı – Piyasayı Bir Bakışta Tam Olarak Okuyun
Çoklu Zaman Dilimi Trend Tarayıcı size cTrader grafiğinizde birden fazla zaman dilimindeki trendin temiz, kompakt bir görünümünü sunar – M5'ten D1'e kadar – ayrıca net bir genel işlem eğilimi:
➡️ Güçlü AL / AL / NÖTR / SAT / Güçlü SAT
Grafikler arasında atlamak ve tahmin etmek yerine, tek bir yerde yapılandırılmış çoklu zaman dilimi trend haritası elde edersiniz.
🧠 Akıllı Trend Skor Motoru
Etkinleştirilen her zaman dilimi için (M5, M15, M30, H1, H4, D1), gösterge üç ana bileşeni kullanarak sağlam bir trend skoru hesaplar:
- 📈 EMA (trend yönü ve eğimi)
-
- Fiyat vs EMA (üstünde/altında)
- EMA eğimi (yükselen/düşen)
- 💪 RSI (momentum)
-
- 50 seviyesi etrafında normalize edilmiştir
- 🌊 ATR (isteğe bağlı volatilite filtresi)
-
- İsteğe bağlı olarak ultra düşük volatilite koşullarını göz ardı edin
Her zaman dilimi -100 ile +100 arasında bir skor alır ve ardından kolay bir duruma çevrilir:
- 🟢 YUKARI – yükseliş eğilimi
- 🔴 AŞAĞI – düşüş eğilimi
- 🟡 YATAY – yatay / belirsiz
Hangi zaman dilimlerinin aynı fikirde olduğunu ve gerçek yön eğiliminin nerede olduğunu anında görürsünüz.
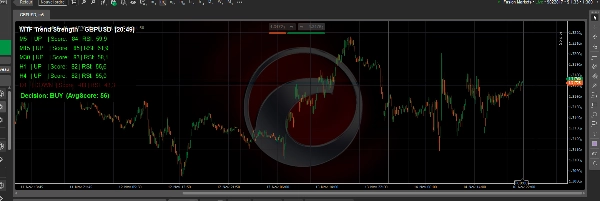
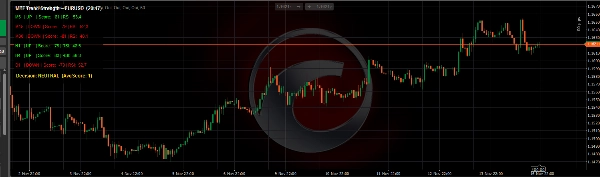
📊 Grafikte Temiz, Hafif Gösterge Paneli
Araç, okunabilir ancak rahatsız etmeyen şekilde grafiğinizin üstüne küçük bir kullanıcı arayüzü paneli çizer:
- Her zaman dilimi için bir satır, örneğin:
M15 | YUKARI | Skor: 63 | RSI: 61.2 - Renk kodlu:
-
- YUKARI için yeşil
- AŞAĞI için kırmızı
- YATAY için altın
- Panel sol üst veya sağ üst köşeye yerleştirilebilir
- Ayarlanabilir panel:
-
- Arka plan rengi ve opaklık
- Yazı tipi boyutu
- Satır yüksekliği
- Boğa / ayı / nötr renkler
Büyük resmi hızlıca onaylamak isteyen scalperlar, günlük ve swing traderlar için mükemmeldir.
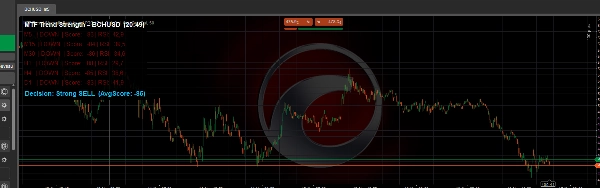
🧭 Küresel İşlem Eğilimi Çizgisi
Panelin altında, Çoklu Zaman Dilimi Trend Tarayıcı tüm aktif zaman dilimlerinin ortalama skorunu hesaplar ve bunu net bir küresel eğilime dönüştürür:
- ✅ Güçlü AL – zaman dilimleri arasında güçlü yükseliş uyumu
- ✅ AL – yükseliş eğilimi, ancak aşırı değil
- ⚪ NÖTR – karışık veya dalgalı piyasa
- ❌ SAT – düşüş eğilimi
- ❌ Güçlü SAT – güçlü düşüş uyumu
Bu, aşağıdakiler için trend ve yön filtresi olarak idealdir:
- Manuel işlem (sadece eğilim yönünde işlem yapın)
- Daha yüksek zaman dilimi onayı ile scalping girişleri
- H1 / H4 / D1 ile uyumlu swing trading
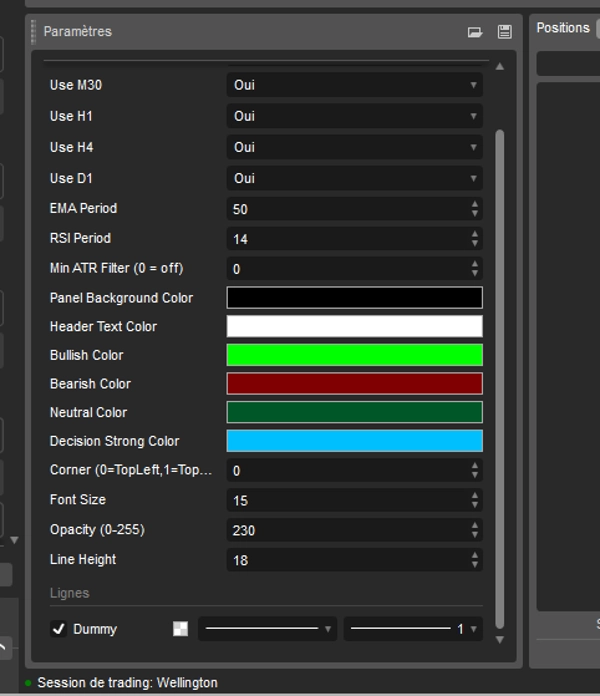
🔧 Tamamen Özelleştirilebilir
Mantık ve görünüm üzerinde tam kontrol sizde:
- Her zaman dilimini etkinleştir/devre dışı bırak (M5, M15, M30, H1, H4, D1)
- Yapılandır:
-
- EMA Periyodu (trend hassasiyeti)
- RSI Periyodu (momentum davranışı)
- ATR minimum filtresi (0 = kapalı)
- Görsel ayarlar:
-
- Panel arka plan rengi ve şeffaflık
- Başlık ve satır metin renkleri
- Boğa / ayı / nötr / güçlü eğilim renkleri
- Yazı tipi boyutu ve satır aralığı
Gösterge, cTrader tarafından desteklenen herhangi bir sembolde çalışır: foreks, endeksler, altın, kripto, hisse senetleri.
Birden fazla zaman dilimindeki trend uyumunu net, objektif ve görsel bir şekilde okumak ve piyasanın alım, satım veya bekleme için daha uygun olup olmadığına hızlıca karar vermek istiyorsanız, Çoklu Zaman Dilimi Trend Tarayıcı cTrader araç kutunuza güçlü bir ektir.
Özet
The indicator displays a compact, color-coded dashboard on the chart, showing one line per timeframe with trend status, score, and RSI value. Users can customize the panel’s position, colors, font size, and which timeframes to include. A global trading bias line at the bottom summarizes the average score across timeframes into five bias states: Strong BUY, BUY, NEUTRAL, SELL, and Strong SELL. This feature supports manual trading, scalping, and swing trading by providing clear directional guidance.
Multi Timeframe Trend Scanner works on any cTrader-supported symbol, including forex, indices, commodities, cryptocurrencies, and stocks. It is designed to help traders quickly assess trend alignment and market bias in a single, easy-to-read interface.
Müşteri değerlendirmeleri
5 | 100 % | |
4 | 0 % | |
3 | 0 % | |
2 | 0 % | |
1 | 0 % |


!["[Stellar Strategies] Inside Bar with Signals" logosu](https://cdn.ctrader.com/image/webp/1d9e8bfa-3b2c-4440-bb37-5856902008a7_30683)
!["[Stellar Strategies] Wave Trend Pro" logosu](https://cdn.ctrader.com/image/webp/5f226fbb-245a-41cd-9cdd-b018257d5e6d_28617)


