
Market Polarity Zones
지표
209 다운로드
버전 1.0, Jul 2025
Windows, Mac
🚀 10,000명 이상의 트레이더들이 이미 우리의 TOP 지표를 사용하고 있습니다 🏆 …그리고 커뮤니티는 계속 성장 중입니다!
전문가들이 우리를 선택하는 이유를 알아보세요 – cTrader의 가장 강력한 도구들 (지표 + 알고리즘 + cBots)가 여러분을 기다리고 있습니다.
👉 모든 TOP 시스템을 여기에서 받으세요:
Pinescriptlabs 스토어 지표: Pinescriptlabs 스토어 cBots : (cBot) Gold & BTC BreakoutSession Pivots(new)
고급 시장 구조: Bos, Choch, SwinLevels, 주문 블록, 시장 구조 및 유동성 탐색기 (New)
추적 스마트 알고리즘 (new)
시장 극성 구역 📊
이 알고리즘은 무엇을 하나요?
시장 극성 구역 은 시장 분석을 단순화하는 고급 지표로, 자동으로 강세 🚀 또는 약세 🐻 국면 을 식별하고 추세 반전이 예상되는 주요 레벨을 표시합니다.
적합한 대상:
- 가격 행동 트레이더
- 스윙 트레이더
- 스캘퍼,...빠르게 시장 방향 과 정확한 진입/청산 지점을 찾아야 하는 분들.
논리는 어떻게 작동하나요?
이 알고리즘은 서로 다른 기간의 두 개의 Hull 이동평균(HMA) 를 사용하여 모멘텀 변화를 감지하고 다음과 같이 동적 레벨을 설정합니다:
- HMA 교차를 감지하여 추세 변화를 식별합니다.
- 자동 레벨을 설정합니다:
-
- 강세 교차 → 저점을 서포트 레벨로 표시합니다.
- 약세 교차 → 고점을 저항 레벨로 표시합니다.
- 새로운 교차가 발생할 때까지 활성 레벨을 유지합니다.
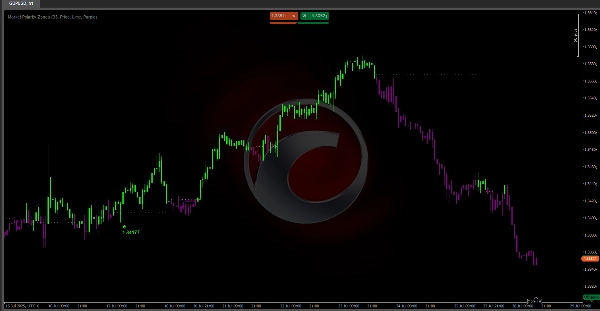
차트에서 보게 될 내용:
🎨 직관적인 색상 시스템:
- 녹색 캔들 🟢: 레벨 위 가격 (강세 구역 – 매수 기회 탐색)
- 보라색 캔들 🟣: 레벨 아래 가격 (약세 구역 – 매도 기회 탐색)
📉 동적 레벨 라인:
- 점선 수평선 활성 극성 레벨을 표시합니다.
- 레벨이 유효한 동안 자동으로 연장됩니다.
- 레벨이 안정될 때만 표시됩니다.
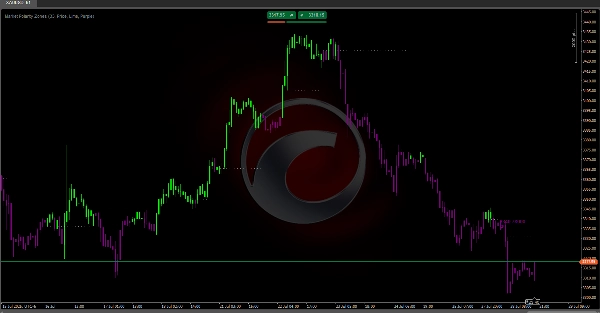
⚠️ 반전 알림:
특정 패턴이 형성될 때 화살표 라벨이 나타납니다:
- 🔻 약세 반전 (보라색 라벨):
-
- 패턴: 가격 상승 → 실패 → 레벨 아래로 하락
- 의미: 강세 압력 약화, 약세 구역으로 전환 가능성
- 🔺 강세 반전 (녹색 라벨):
-
- 패턴: 가격 하락 → 반등 → 레벨 위로 상승
- 의미: 매수자들이 레벨을 방어, 강세 구역으로 전환 가능성
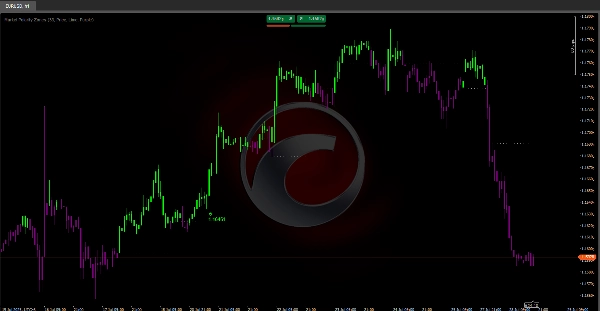
ℹ️ 라벨 정보:
- "가격": 정확한 돌파 실패 지점을 보여줍니다 – 정밀한 스톱 설정이나 주요 저항/서포트 식별에 사용하세요.
- "거래량": 최근 3개 바의 거래량 합계 – 반전이 실제 시장 참여를 수반하는지 확인합니다.
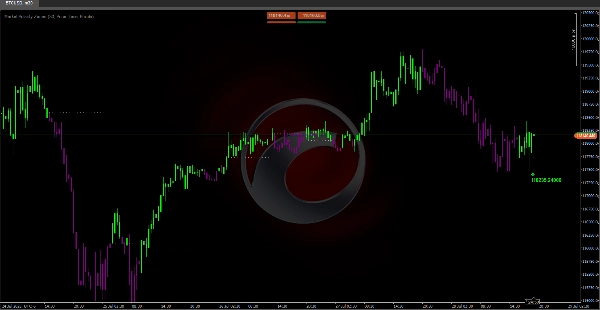
추천 설정:
- 길이: 33 (기본값) – 대부분 시장에 적합합니다.
- 라벨 데이터: 정밀도를 위한 "가격", 확인용 "거래량"
- 색상: 최상의 시각적 대비를 위해 라임/퍼플 유지 🎨
지표 프로필
0.0
리뷰: 0
고객 리뷰
이 상품에 대한 리뷰가 아직 없습니다. 이미 사용해 보셨나요? 다른 사람들에게 가장 먼저 소개해 주세요!
트레이딩 봇, 지표, 플러그인 등 cTrader Store에서 제공되는 상품은 제3자 개발자에 의해 제공되며, 이는 단순히 정보 및 기술적 접근을 목적으로 제공된 것입니다. cTrader Store는 중개인이 아니며, 투자 조언, 개인별 추천 또는 향후 성과에 대한 어떠한 보장도 제공하지 않습니다.


가입일 03/10/2024
157
판매
36.39K
무료 설치