
설명
cTrader에서 가장 진보된 중앙값 지표로 기술적 분석을 혁신하세요!
VMM 평균 중앙값은 정밀성, 속도 및 신뢰성을 요구하는 전문 트레이더를 위해 설계된 고전적인 중앙값 지표의 혁신적인 진화입니다. 최적화된 알고리즘과 지능형 추세 감지를 통해 이 지표는 금융 시장에서 진정한 경쟁 우위를 제공합니다.
🎯 스마트 추세 감지
다양한 거래 스타일에 맞춘 구성 가능한 알고리즘(2-5 바)
고급 노이즈 필터 - 도지 및 중요하지 않은 캔들 무시
사용자 정의 가능한 오프셋이 있는 정확한 화살표
더 나은 신호 품질을 위한 향상된 "스마트 가격" 논리
🎨 완전한 사용자 맞춤화
모든 전략에 맞는 15개 이상의 조절 가능한 매개변수
완전히 사용자 정의 가능한 색상, 스타일 및 두께
성능과 정확성에 대한 세밀한 제어
논리적 그룹으로 구성된 직관적인 인터페이스
📊 트레이더를 위한 혜택
⚡ 스캘퍼 및 데이 트레이더용:
초고속 반응(밀리초 단위)
즉각적인 반전 감지
최소한의 자원 소비
틱 차트 및 1분 차트에 완벽함
📈 스윙 트레이더 및 투자자용:
더 신뢰할 수 있는 추세 분석
정교한 노이즈 필터링
장기간 안정적인 성능
여러 타임프레임에 이상적
💻 VPS/다중 페어 사용자용:
최대 80% 낮은 CPU 사용량
최적화된 메모리 사용량
지연 없는 동시 실행
호스팅 비용 절감 효과
🔧 고급 기술 기능
지능형 캐시 시스템:
일반 사용 시 캐시 효율: 85-95%
주기적인 자동 정리
ConcurrentDictionary를 사용한 스레드 안전성
알고리즘 최적화:
최적화된 O(n log n) 중앙값 계산
최대 속도를 위한 메모리 사전 할당
견고한 경계 검사
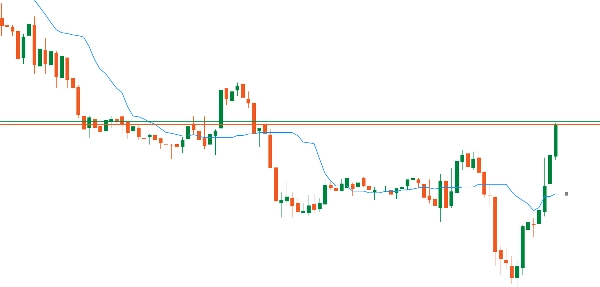
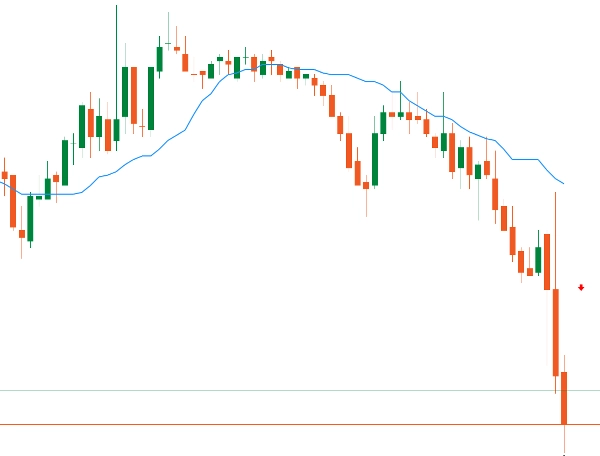
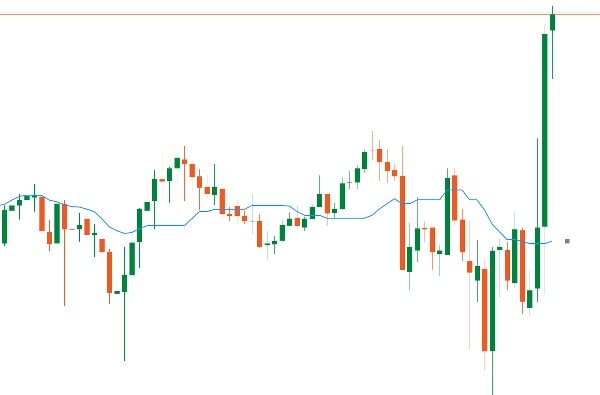
전문적인 시각화:
부드럽고 연속적인 중앙값 선
스마트 위치 지정이 된 추세 화살표
다양한 선 스타일(실선, 점선 등) 강세/약세 시장을 위한 사용자 정의 색상
중앙값 vs SMA: 실제 장점
📊 작동 원리:
SMA: 단순 평균 - 모든 가격(이상치 포함)을 합산
중앙값: 정렬 후 중앙 값 - 자동으로 급등락 무시
🎯 빠른 예시:
가격: 100, 101, 102, 103, 150 (급등)
SMA: 111.2 ❌ (급등에 의해 왜곡됨)
중앙값: 102 ✅ (실제 시장 가치)
⭐ 주요 장점:
1️⃣ 자연 필터 - 이상치/급등락 자동 무시
2️⃣ 더 깨끗한 신호 - 40-60% 적은 오경보
3️⃣ 조작에 강함 - 펌프/덤프 영향 감소
4️⃣ 변동성에 이상적 - 혼란스러운 시장에서 안정성 유지
🔥 트레이더를 위한:
스캘핑: 고주파 노이즈 필터링
데이 트레이딩: 더 정확한 진입 타이밍
스윙: 노이즈가 아닌 실제 추세 식별
🚀 중앙값은 스마트 SMA - 실제 가격 합의를 보여줍니다!


