설명
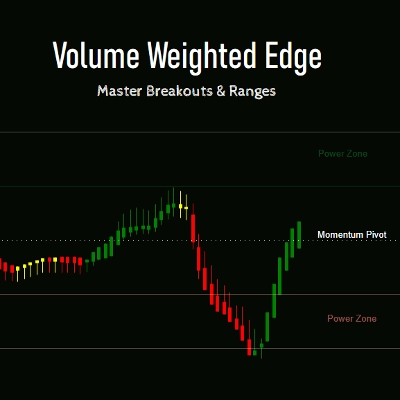
거래량 가중 엣지: cTrader 모멘텀을 위한 완벽한 로드맵
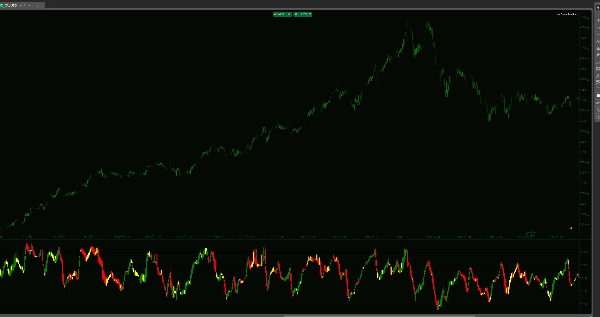
표준 지표는 가격이 어디에 있었는지를 보여줍니다. 거래량 가중 RSI 캔들 지표는 움직임 뒤에 있는 확신을 보여줍니다. 가격 움직임, 틱 거래량, 그리고 다섯 가지 중요한 기관 수준을 결합하여 이 도구는 RSI를 단순한 오실레이터에서 포괄적인 추세 매핑 시스템으로 변모시킵니다.
단일 선 대신, 지표 창에서 전체 OHLC 캔들을 볼 수 있습니다. 이를 통해 모멘텀의 "구조"를 볼 수 있어, 움직임이 무거운 기관 거래량에 의해 뒷받침되는지 아니면 단순히 유동성이 낮은 "속임수"인지 알 수 있습니다.
5존 실행 전략
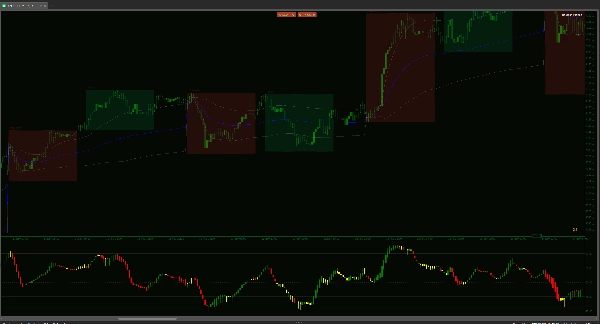
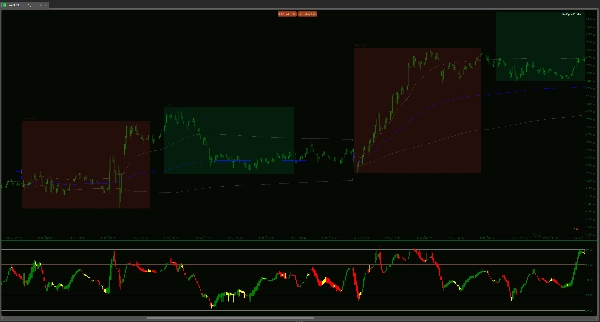
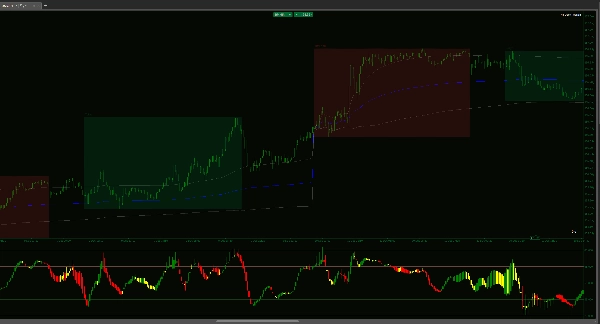
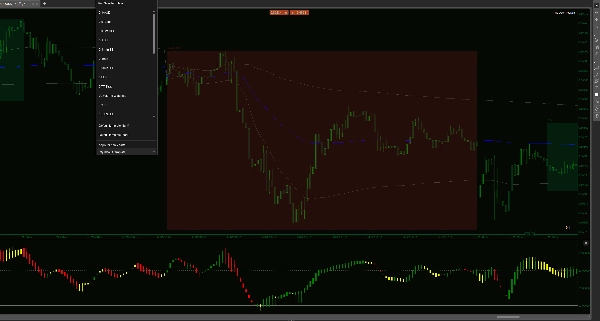
- 파워 확장 구간 (65–80 & 20–35): 이 구간은 강한 확신의 영역입니다. 거래량 가중 캔들이 이곳에서 지속되면, 반전을 찾는 것이 아니라 추세를 따라가는 것입니다. 이곳이 바로 큰 자금이 움직이고 가장 폭발적인 움직임이 발생하는 곳입니다.
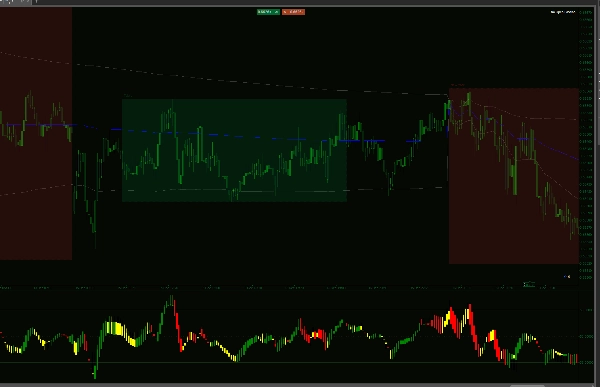
- 스캘핑 회랑 (50–65 & 35–50): 아시아 세션이나 횡보장에 적합합니다. 상위 시간대 추세가 중립일 때, 이 구간은 높은 확률의 "평균 회귀" 목표를 제공합니다. 시장이 횡보할 때, 이 회랑은 회전을 정밀하게 스캘핑할 수 있게 해줍니다.
- 모멘텀 피벗 (50): 궁극적인 경계선입니다. 이 수준을 넘는 거래량 가중 캔들 몸통의 마감은 시장 통제의 구조적 변화에 대한 첫 번째 경고입니다.
이 도구가 작업 흐름을 바꾸는 이유
거래량 가중 명확성: 모든 캔들은 가격 변동에 틱 거래량을 곱하여 계산됩니다. 거래량이 적은 움직임은 RSI 캔들이 확인하지 않습니다. 이는 가격 차트상으로 좋아 보이지만 뒷받침이 없는 "함정" 움직임에서 벗어나게 해줍니다.
캔들 몸통 인사이트: 전통적인 RSI 선은 불안정하고 들쭉날쭉합니다. 우리의 WMA로 부드럽게 처리된 캔들은 모멘텀의 "시작"과 "종료"를 보여줍니다. RSI 캔들 몸통이 두껍고 견고하면 추세가 건강한 것입니다. 꼬리가 길면 모멘텀이 소진된 것입니다.
다중 시장 다재다능성: * 추세: 65–80 구간을 사용하여 승리하는 거래를 더 오래 유지하세요.
횡보/스캘핑: 35–65 회랑을 사용하여 아시아와 같은 낮은 변동성 세션 동안 빠른 회전을 포착하세요.
"바코드" 함정 피하기: 대부분의 지표는 낮은 변동성 기간 동안 추측하게 만듭니다. 이 지표는 통합 기간 동안 독특한 시각적 "바코드" 효과를 특징으로 합니다. 캔들이 조여지고 평평해지며 중립으로 변할 때, 지표는 "시장 엔진"이 꺼졌다는 신호를 보냅니다. 이 시각적 경고는 낮은 거래량의 속임수 진입과 가격 움직임 뒤에 실제 자금이 없을 때 "잘려 나가는" 상황을 피하게 해줍니다.
네이티브 cTrader 최적화: C# API를 위해 특별히 제작되었으며 "최대 시각 캔들" 논리를 통해 1분 차트에서도 플랫폼의 반응성을 유지합니다.
시장이 어디로 갈지에 따라 거래를 멈추세요. 실제로 거래량이 어디로 밀어내는지에 따라 거래를 시작하세요. 이 지표는 단순한 신호가 아니라 시장 내부 에너지를 이해하는 데 관한 것입니다.
요약
고객 리뷰
5 | 33 % | |
4 | 67 % | |
3 | 0 % | |
2 | 0 % | |
1 | 0 % |


