
คำอธิบาย
🚀 Volume Profile Pro สำหรับ cTrader
ปลดล็อกโครงสร้างที่แท้จริงเบื้องหลังการเคลื่อนไหวของราคา ด้วย Volume Profile Pro ตัวบ่งชี้ Volume-by-Price ที่ทรงพลังและปรับแต่งได้อย่างเต็มที่ ออกแบบมาเฉพาะสำหรับเทรดเดอร์มืออาชีพบน cTrader
เครื่องมือขั้นสูงนี้แสดงภาพ โปรไฟล์ปริมาณรายบุคคลตามช่วงเวลาที่เลือก ช่วยให้คุณเห็นได้ชัดเจนว่ากิจกรรมของสถาบันอยู่ที่ใด — โดยตรงภายในแผนภูมิของคุณ
🔎 สิ่งที่มันทำ
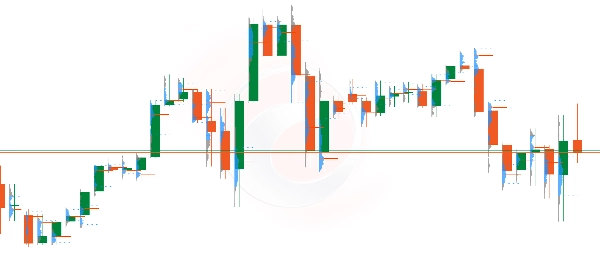
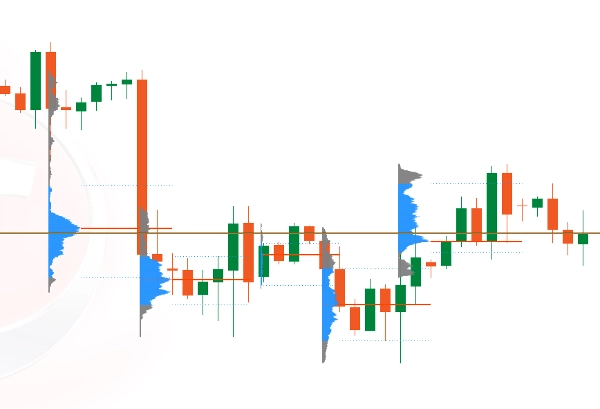
Volume Profile Pro คำนวณและแสดง การกระจายปริมาณในช่วงเวลาคงที่ สำหรับแต่ละช่วงเวลาที่เสร็จสมบูรณ์ (H1, M15, D1 เป็นต้น) วางไว้โดยตรงบนแกนราคาเพื่อการวิเคราะห์โครงสร้างที่แม่นยำ
แต่ละโปรไฟล์:
- ถูกวาดแยกตามแต่ละช่วงเวลา
- ใช้ช่วงราคาคงที่ที่สม่ำเสมอ
- แสดงการกระจายปริมาณตามระดับราคา
- เน้นระดับสำคัญของสถาบัน
โปรไฟล์ถูกจัดวางอย่างชัดเจนที่ ด้านซ้ายของแท่งเทียนแต่ละแท่ง เพื่อให้สามารถรับรู้โครงสร้างได้อย่างชัดเจนโดยไม่บดบังการเคลื่อนไหวของราคา
⚡ คุณสมบัติหลัก
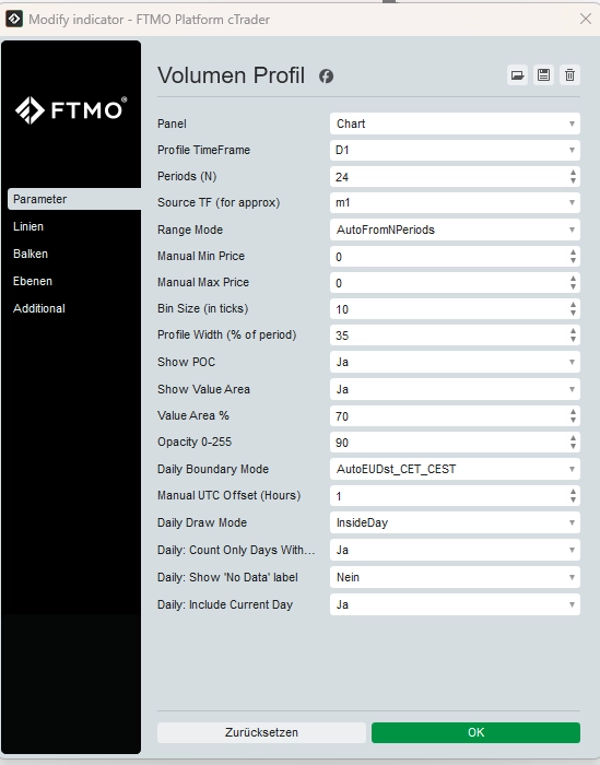
✔ โปรไฟล์ปริมาณรายบุคคลตามช่วงเวลาที่กำหนด
✔ เลือกช่วงเวลาของโปรไฟล์ได้ (M15, H1, H4, D1 เป็นต้น)
✔ ช่วงราคาคงที่ (อัตโนมัติหรือด้วยตนเอง)
✔ เน้นจุดควบคุม (POC)
✔ ค่าพื้นที่สูง (VAH) และค่าพื้นที่ต่ำ (VAL)
✔ การแสดงผลที่ราบรื่นโดยไม่มีการกะพริบของแผนภูมิ
✔ ปรับแต่งเต็มประสิทธิภาพสำหรับการทำงาน
✔ ออกแบบสำหรับสภาพแวดล้อม CFD และ Tick Volume
📊 เหตุผลที่เทรดเดอร์ใช้
- ระบุโซนการสะสมและการกระจายของสถาบัน
- ค้นหาระดับปฏิกิริยาที่มีความน่าจะเป็นสูง
- ยืนยันความแข็งแกร่งของการเบรคเอาท์
- ปรับปรุงการเข้าตลาดภายในช่วงการรวมตัว
- จัดโครงสร้างปริมาณให้สอดคล้องกับการเคลื่อนไหวของราคา
ไม่ว่าคุณจะเป็นสแคลเปอร์ เทรดเดอร์รายวัน หรือเทรดเดอร์สวิง Volume Profile Pro จะช่วยให้คุณได้เปรียบด้านโครงสร้าง
⚠ ข้อจำกัดความรับผิดชอบที่สำคัญ
Volume Profile เป็นเครื่องมือซอฟต์แวร์การเทรดและ ไม่ใช่คำแนะนำทางการเงินหรือการลงทุน.
การเทรด Forex, CFDs และเครื่องมือทางการเงินอื่น ๆ มีความเสี่ยงสูงและอาจทำให้สูญเสียทุนได้
🎯 สร้างขึ้นเพื่อความแม่นยำ ออกแบบสำหรับมืออาชีพ
ยกระดับการวิเคราะห์โครงสร้างตลาดของคุณไปอีกขั้น และเทรดด้วยความชัดเจน ความมั่นใจ และการควบคุม
สรุป
รีวิวจากลูกค้า
5 | 100 % | |
4 | 0 % | |
3 | 0 % | |
2 | 0 % | |
1 | 0 % |