Descrizione
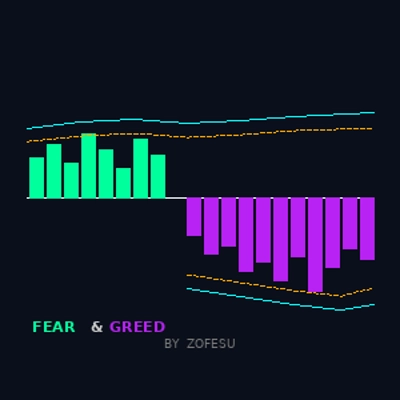
📊 Fear & Greed di Zofesu — Motore VIX Doppio | Rilevamento del Sentimento Istituzionale
Fear & Greed è un oscillatore di precisione basato su un doppio motore Williams VIX Fix — uno calibrato per il panico (Fear), uno per l’euforia (Greed). Identifica i momenti in cui il surriscaldamento istituzionale raggiunge livelli statisticamente estremi, segnalando zone di inversione ad alta probabilità.
⚙ COME FUNZIONA
L’indicatore esegue due calcoli WVF indipendenti:
Motore Fear — misura quanto il minimo attuale si discosta dalla chiusura più alta recente. I picchi segnalano capitolazione e panico.
Motore Greed — misura quanto il massimo attuale si discosta dal minimo più basso recente. I picchi segnalano un’eccessiva estensione euforica.
Ogni motore è filtrato attraverso due soglie indipendenti:
1. Limite superiore/inferiore della Banda di Bollinger (2× Deviazione Standard)
2. Soglia di rango percentile (configurabile)
Una barra dell’istogramma appare SOLO quando il prezzo supera ENTRAMBE o UNA delle soglie — eliminando il rumore e mostrando solo gli estremi statisticamente significativi.
🔑CARATTERISTICHE PRINCIPALI
✅ Doppio motore WVF — Fear (Lime) e Greed (Viola) calcolati indipendentemente con finestre di lookback separate
✅ Bande BB — limiti dinamici delle Bande di Bollinger per ogni motore
✅ Linee Percentili — soglie di rango percentile configurabili
✅ Output pulito dell’istogramma — barre visibili solo alle letture estreme
✅ Tutte e 4 le linee di confine attivabili/disattivabili indipendentemente
✅ Completamente configurabile — lookback e percentile separati per Fear e Greed
✅ Funziona su tutti gli asset e timeframe
✅ C# leggero — nessun impatto sulle prestazioni
📚COME USARLO
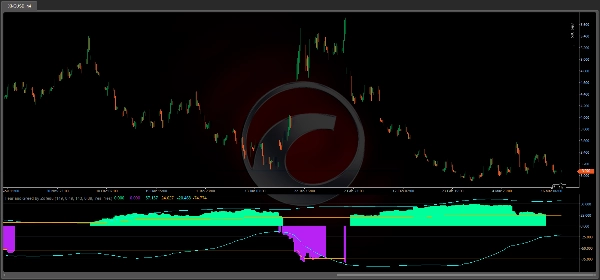
1. Aggiungi l’indicatore a qualsiasi grafico come pannello separato
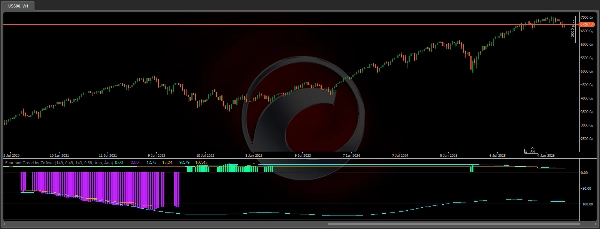
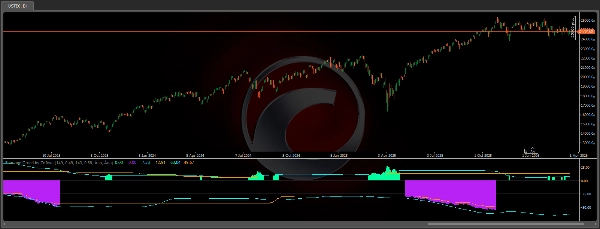
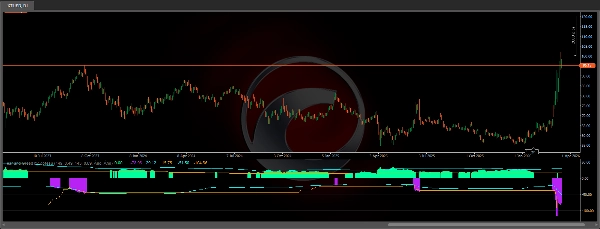
2. Istogramma lime = picco di Fear — potenziale zona di inversione rialzista
3. Istogramma viola = picco di Greed — potenziale zona di inversione ribassista
4. Linee acqua = limiti BB per ogni motore
5. Linee tratteggiate arancioni = soglie percentile
6. Usalo in congiunzione con l’azione del prezzo, livelli S/R, SuperTrend o VWAP
7. I timeframe più alti (D1, W1) producono i segnali più affidabili Migliori risultati su: H1, H4, D1 Funziona su: Indici (NAS100, SPX500), Crypto (BTCUSD), Forex, Oro, Petrolio, Azioni.
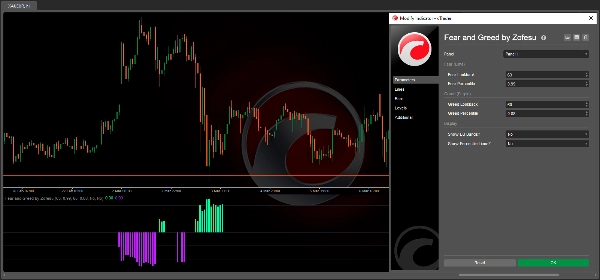
🔗PARAMETRI
Fear (Lime):
- Lookback Fear — barre per il calcolo WVF e BB (default 149)
- Percentile Fear — soglia di rango percentile (default 0,49)
Greed (Viola):
- Lookback Greed — barre per il calcolo WVF e BB (default 143)
- Percentile Greed — soglia di rango percentile (default 0,89)
Visualizzazione:
- Mostra Bande BB — attiva/disattiva le linee di confine acqua
- Mostra Linee Percentili — attiva/disattiva le linee di soglia arancioni
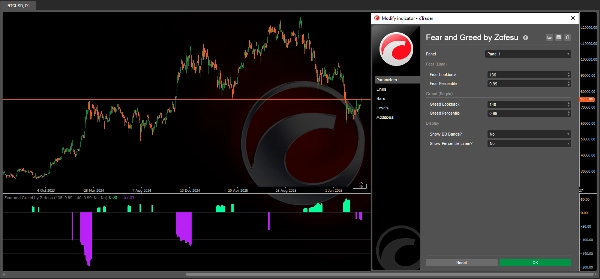
🎯 GUIDA ALLA CALIBRAZIONE (DA ESPERIENZA)
Ogni asset e timeframe richiede impostazioni uniche — l’indicatore è progettato per permettere questa flessibilità.
Passo 1 — Trova il Lookback giusto:
Imposta prima il Percentile a 0,99, poi sperimenta il valore Lookback tra 10 e 1000.
Un Lookback più alto riduce il rumore ma può anche nascondere segnali validi. L’intervallo consigliato è 50–500 per la maggior parte delle configurazioni.
Passo 2 — Regola finemente il Percentile:
Una volta trovato un Lookback adeguato, riduci gradualmente il Percentile da 0,99 verso il basso. Questo allenta il filtro e rivela segnali aggiuntivi. I parametri Fear e Greed non devono necessariamente corrispondere.
Passo 3 — Interpretazione del segnale:
- La barra Fear scompare su una candela chiusa → potenziale ingresso Long sulla candela successiva.
- La barra Greed scompare su una candela chiusa → potenziale ingresso Short sulla candela successiva.
- Fear o Greed accesi per più barre = il mercato è in trend o sta accumulando posizioni — non necessariamente un’inversione.
- Entrambi Fear e Greed accesi simultaneamente = pressione conflittuale. Controlla prima il timeframe superiore. C’è un livello chiave S/R nelle vicinanze? Se sì, aspetta la conferma prima di entrare.
Il numero di segnali dipende interamente da te e dalla tua strategia — impostazioni più rigorose danno meno ingressi ma di qualità superiore. Dopo aver trovato l’impostazione corretta, puoi disattivare le linee nelle impostazioni per non essere disturbato.
⚠️ AVVISO Il trading di strumenti finanziari comporta un rischio sostanziale di perdita. Le performance passate di qualsiasi indicatore o strategia non garantiscono risultati futuri. Questo strumento è fornito solo a scopo informativo ed educativo. Usa sempre una gestione del rischio adeguata e non rischiare mai più di quanto puoi permetterti di perdere. L’autore non è responsabile per eventuali perdite di trading derivanti dall’uso di questo indicatore.
Riepilogo
Recensioni dei clienti
5 | 0 % | |
4 | 100 % | |
3 | 0 % | |
2 | 0 % | |
1 | 0 % |


