
Açıklama
TeoriaCutrim, mum dağılımı ve volatilite analizi yoluyla son piyasa davranışını nicelleştirmek için tasarlanmış istatistiksel bir üst gösterge göstergesidir. Yön tahmini yapmak yerine, yapılandırılabilir bir mum penceresi içinde piyasanın az önce ne yaptığını objektif verilerle sunar.
Analiz Edilen Piyasa Verileri
Gösterge, kullanıcı tarafından tanımlanan sayıda son mumu (Geriye Dönük dönem) değerlendirir ve şunları çıkarır:
- Boğa mumlarının sayısı ve yüzdesi (kapanış > açılış)
- Ayı mumlarının sayısı ve yüzdesi (kapanış < açılış)
- Boğa ve ayı hakimiyeti arasındaki fark
- Ortalama mum aralığı (pip cinsinden)
- Mevcut mum aralığı (pip cinsinden)
- Analiz edilen pencere boyunca toplam fiyat aralığı
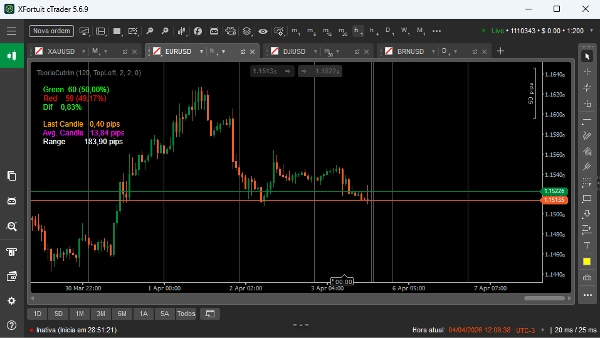
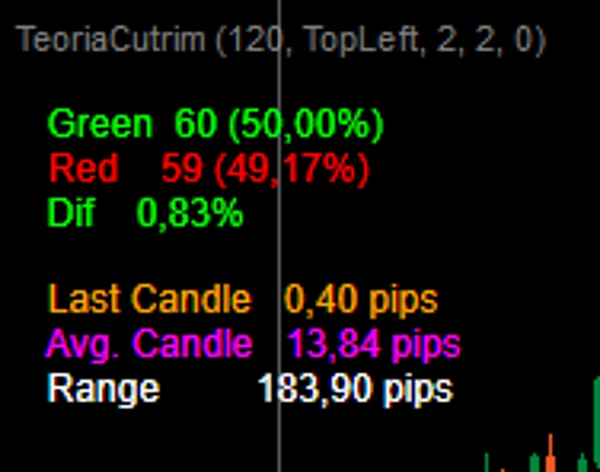
Görsel Çıktı ve Yorumlama
Gösterge, ana metrikleri doğrudan grafikte gösterir:
- Yeşil: toplam boğa mumları ve yüzdesi
- Kırmızı: toplam ayı mumları ve yüzdesi
- Fark: boğa ve ayı yüzdeleri arasındaki mutlak fark
- Son Mum: mevcut mumun pip cinsinden büyüklüğü
- Ortalama Mum: seçilen penceredeki mumların ortalama büyüklüğü
- Aralık: penceredeki en yüksek yüksek ve en düşük düşük arasındaki mesafe
Yorumlama basittir:
- Daha fazla boğa mumu, son dönemde yukarı yönlü baskı olduğunu gösterir
- Daha fazla ayı mumu, son dönemde aşağı yönlü baskı olduğunu gösterir
- Düşük fark (Fark), denge veya rastgeleliği gösterir
- Artan ortalama mum büyüklüğü, genişleyen volatiliteyi gösterir
- Büyük toplam aralık piyasa genişlemesini, küçük aralık sıkışmayı gösterir
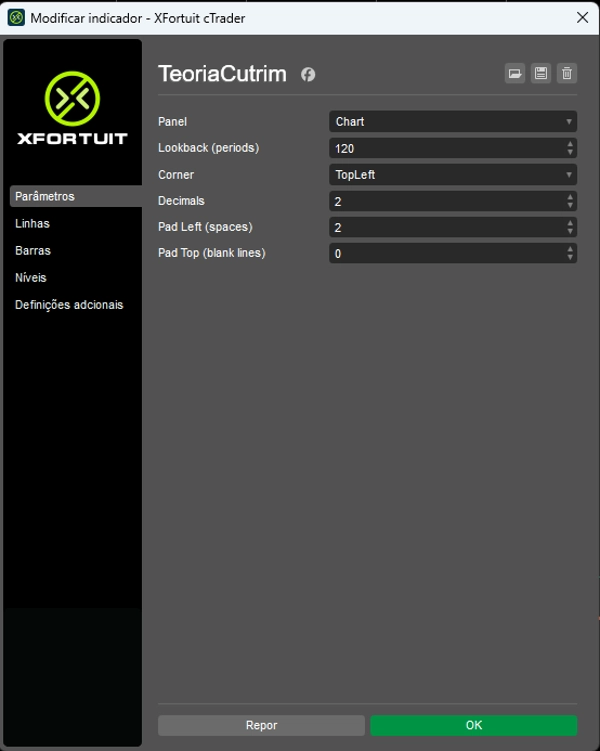
Ana Parametreler
- Geriye Dönük: analiz için kullanılan mum sayısı (tamamen ayarlanabilir)
- Köşe: veri görüntüleme ekran konumu
- Ondalık: gösterilen ondalık basamak sayısı
- Sol Boşluk / Üst Boşluk: görsel boşluk ayarları
Kullanım Alanları
TeoriaCutrim, bir sinyal üreticisi değil, bağlam aracı olarak en iyi şekilde kullanılır. Tipik uygulamalar şunları içerir:
- İşlemlere girmeden önce istatistiksel dengesizliği ölçmek
- Volatilite genişlemesini veya daralmasını tanımlamak
- Son mum davranışına göre işlemleri filtrelemek
- Nicel veya olasılığa dayalı stratejileri desteklemek
Hedef Kullanıcı
Bu gösterge, öznel desen tanımından ziyade veri, istatistik ve objektif analize dayanan tüccarlar için tasarlanmıştır. Hem takdirli hem de sistematik tüccarlar için uygundur.


