
DynamicVolumeSupplyDemand
지표
1.29K 다운로드
버전 1.0, Apr 2025
Windows, Mac
4.2
리뷰: 5
설명
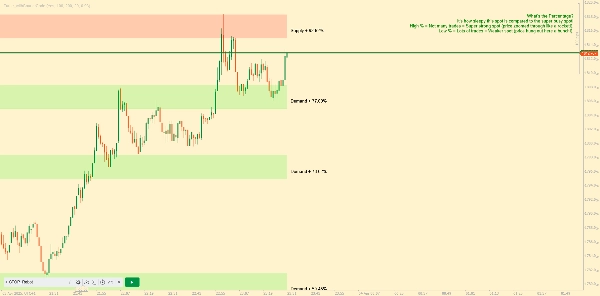
Ctrader 플랫폼용으로 제가 재창조한 AlgoAlpha의 동적 수요 및 공급 구역을 소개합니다. 이 지표는 차트에서 동적 수요 및 공급 구역을 자동으로 식별하고 시각화하도록 설계되어, 트레이더가 잠재적 반전 구역을 정확히 찾아내고 시장 심리를 더욱 명확하게 평가할 수 있도록 도와줍니다. 동적 되돌아보기 메커니즘을 사용하여 시장 상황에 적응하며, 최근 가격 움직임에 더 민감하게 반응합니다. 📈💡
주요 특징
- 📊 동적 되돌아보기: 가장 최근의 피벗 포인트를 기준으로 되돌아보기 기간을 자동 조정하여 가장 관련성 높은 데이터를 분석합니다.
- 🎯 피벗 포인트 감지: 사용자가 정의한 기간을 활용하여 중요한 피벗 고점과 저점을 감지하고, 잠재적 반전 지점을 정밀하게 표시합니다.
- 🛠 사용자 정의 매개변수: 되돌아보기 기간, 피벗 감지 민감도, 해상도 및 구역 허용 오차 등 광범위한 맞춤 설정 옵션을 제공합니다.
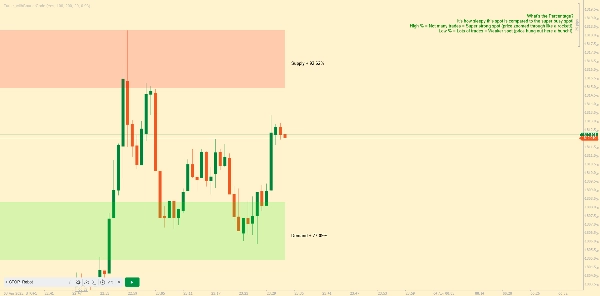
- 🗺 시각적 표시: 차트에 상자 형태로 수요 및 공급 구역을 표시하며, 배경 하이라이트로 강세와 약세 구역을 구분합니다.
- 🖍 색상 구분 구역: 구역은 쉽게 식별할 수 있도록 색상으로 구분됩니다: 강세는 녹색, 약세는 빨간색, 중립 수준은 회색입니다.
요약
AI 요약
DynamicVolumeSupplyDemand is an indicator for the cTrader platform that automatically identifies and visualizes dynamic supply and demand zones on trading charts. It helps traders locate potential reversal areas and evaluate market sentiment by adapting to recent price movements through a dynamic look-back mechanism. Key features include:
- Dynamic Look-Back: Automatically adjusts the look-back period based on the latest pivot points to analyze the most relevant data.
- Pivot Point Detection: Uses a user-defined period to detect significant pivot highs and lows, marking potential reversal points.
- Customizable Parameters: Allows adjustment of look-back period, pivot detection sensitivity, resolution, and zone tolerance.
- Visual Display: Presents supply and demand zones as boxes on the chart with background highlighting to distinguish bullish and bearish zones.
- Color-Coded Zones: Zones are color-coded for clarity—green for bullish, red for bearish, and gray for neutral levels.
This indicator supports enhanced clarity in market analysis by dynamically adapting to changing market conditions and providing clear visual cues for supply and demand levels.
지표 프로필
고객 리뷰
4.2
리뷰: 5
5 | 40 % | |
4 | 40 % | |
3 | 20 % | |
2 | 0 % | |
1 | 0 % |
고객 리뷰
October 12, 2025
Could you please make a new indicator so too remove the explanation and how the indicator works written on the chart? Very nice indicator otherwise!
August 12, 2025
Pros: Identifies dynamic supply and demand zones based on volume. Flexible settings, strong visual clarity. Cons: No alerts or tooltips. Lacks history of previous zones and user template saving.
May 15, 2025
This indicator finds the supply and demand areas very well but it has a problem. But the explanation and how the indicator works written on the chart is very annoying. I hope the designer of this software will solve this problem. Thank you
상담
자주 묻는 질문(FAQ)
트레이딩 봇, 지표, 플러그인 등 cTrader Store에서 제공되는 상품은 제3자 개발자에 의해 제공되며, 이는 단순히 정보 및 기술적 접근을 목적으로 제공된 것입니다. cTrader Store는 중개인이 아니며, 투자 조언, 개인별 추천 또는 향후 성과에 대한 어떠한 보장도 제공하지 않습니다.


!["[Hamster-Coder] Moving Average MTF" 로고](https://cdn.ctrader.com/image/webp/b11b98b1-194d-4b8e-b00e-d611826ad159_31226)


가격
가입일 09/01/2025
11.78K
무료 설치