Order Flow
インジケーター
253 ダウンロード数
バージョン 1.0、Jul 2025
Windows、Mac
説明
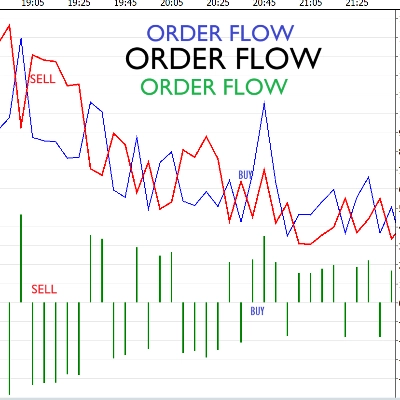
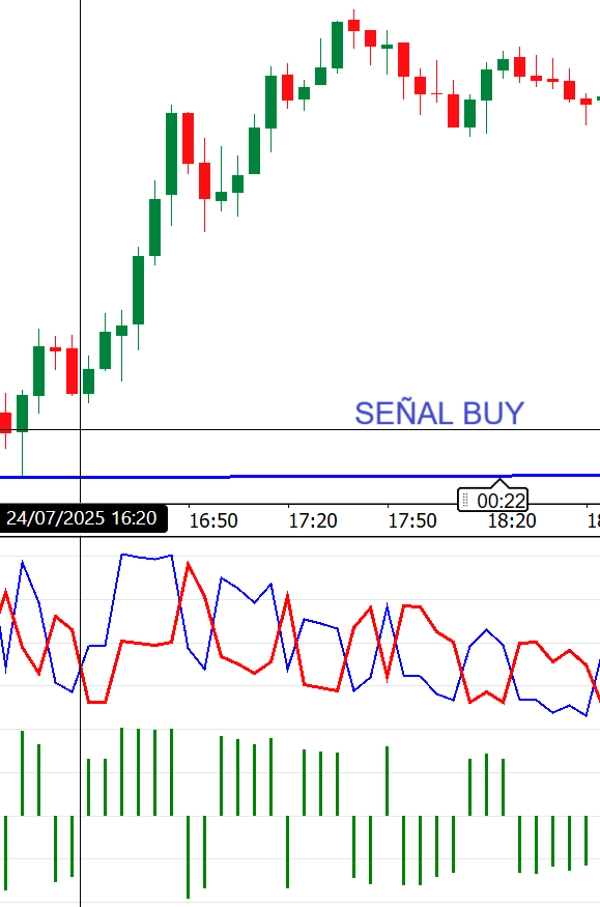
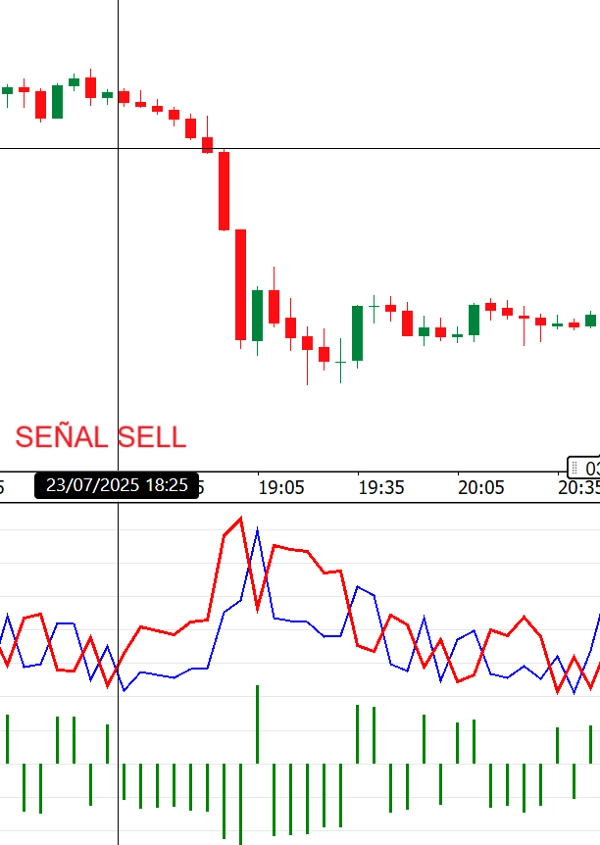
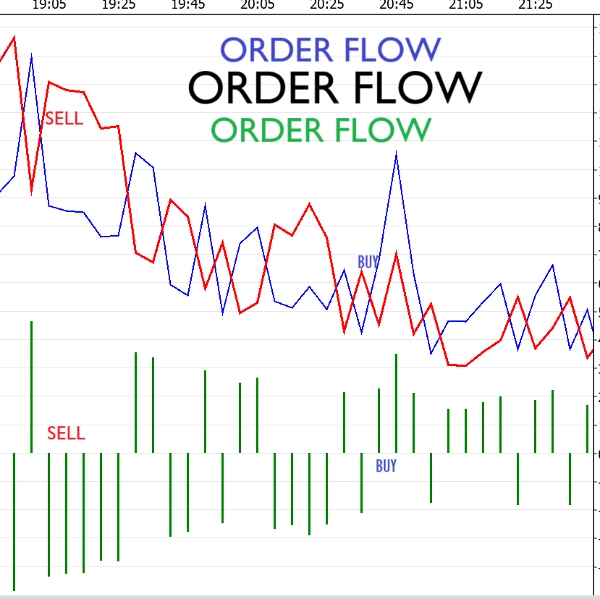
価格の方向を確認する:
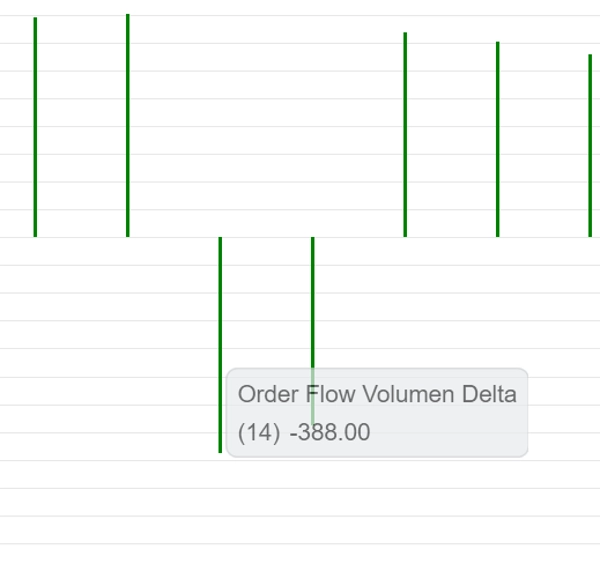
- 価格が上昇していて、デルタボリュームが正(ゼロ以上の緑のヒストグラム)であれば、買い圧力があることを確認でき、上昇トレンドを利用するために買い取引(「buy」)に入ることを示唆します。
- 価格が下落していて、デルタボリュームが負(ゼロ以下の緑のヒストグラム)であれば、売り圧力を確認でき、売り取引(「sell」)を行う良いタイミングかもしれません。
概要
AIによる概要
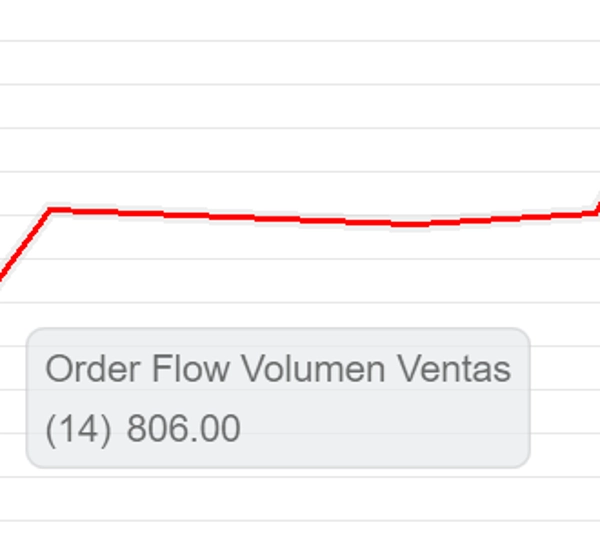
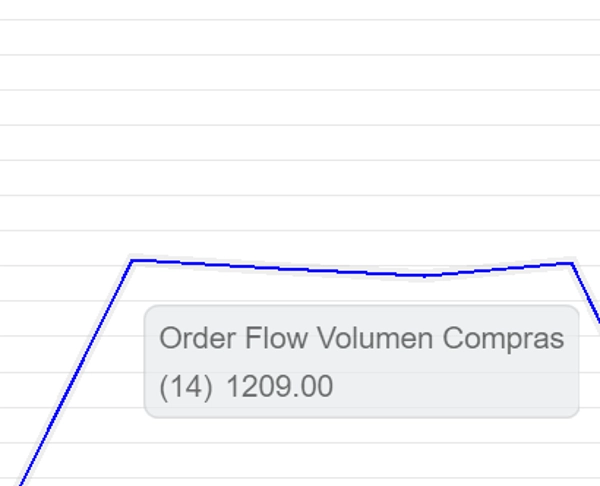
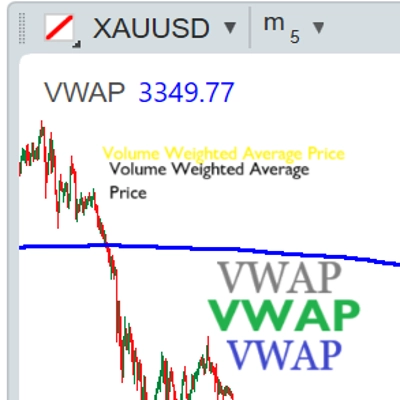
Order Flow is a volume delta indicator that visually represents order flow based on transaction volume. It displays a histogram showing the difference between buying and selling volume to help confirm price direction. When the price rises and the volume delta is positive (histogram above zero), it indicates buying pressure, suggesting a potential buy opportunity. Conversely, when the price falls and the volume delta is negative (histogram below zero), it indicates selling pressure, suggesting a potential sell opportunity. This indicator supports various markets including Forex, cryptocurrencies (e.g., BTCUSD, ETH), commodities (e.g., gold, oil), indices (e.g., NAS100, SP500), and stocks. It is tagged for use with strategies such as breakout, scalping, martingale, grid, and incorporates volume-related indicators like VWAP and Supertrend. The visual signals assist traders in confirming market momentum and making informed entry decisions based on volume-driven order flow analysis.
インジケーターのプロフィール
カスタマーレビュー
0.0
レビュー: 0
カスタマーレビュー
この商品にはまだレビューがありません。お使いになったことがある方は、ぜひレビューをお願いします。
ディスカッション
よくあるご質問
BTCUSD
Forex
Signal
Breakout
Indices
EURUSD
Commodities
GBPUSD
NZDUSD
Martingale
Prop
Scalping
Supertrend
Crypto
Grid
Stocks
XAUUSD
NAS100
USDJPY
VWAP
cTrader Storeで入手可能な取引ボット、インジケーター、プラグインなどの商品は、第三者の開発者が提供するものであり、情報と技術の取得のみを目的としてご利用いただけます。cTrader Storeはブローカーではなく、投資助言や個人的な推奨を行うことも、将来のパフォーマンスを保証することもありません。
この作成者の他の商品


これも好きかも


価格
412.95K
取引数量
24.92K
獲得pips
6
販売
647
無料インストール