Penerangan
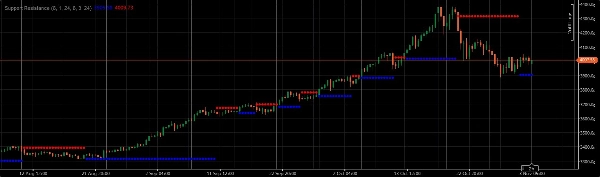
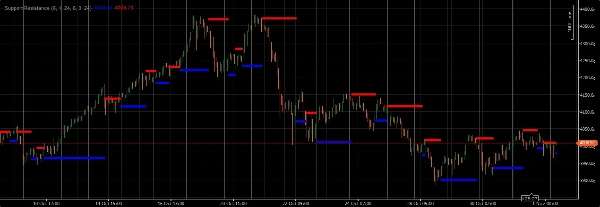
Apabila berdagang emas, gunakan tahap sokongan dan rintangan merentasi pelbagai jangka masa (graf besar, julat, dan tik) untuk mengenal pasti potensi pecahan pivot atau titik sokongan/rintangan. Sentiasa sahkan isyarat ini dengan penunjuk teknikal lain seperti purata bergerak, osilator, dan corak lilin untuk perdagangan dengan kebarangkalian lebih tinggi
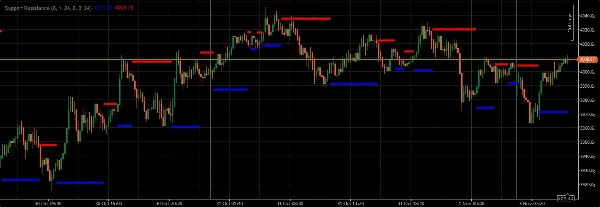
Apabila berdagang emas, gunakan tahap sokongan dan rintangan merentasi pelbagai jangka masa (graf besar, julat, dan tik) untuk mengenal pasti potensi pecahan pivot atau titik sokongan/rintangan. Apabila berdagang emas, gunakan tahap sokongan dan rintangan merentasi pelbagai jangka masa (graf besar, julat, dan tik) untuk mengenal pasti potensi pecahan pivot atau titik sokongan/rintangan. Tahap-tahap ini, setelah dikenal pasti, boleh berfungsi sebagai titik keputusan penting. Pecahan di atas rintangan atau di bawah sokongan, terutamanya apabila disertai dengan lilin badan yang meningkat, sering menandakan kesinambungan trend atau perubahan ketara dalam sentimen pasaran. Sebaliknya, pantulan dari tahap sokongan atau penolakan di rintangan boleh menunjukkan potensi pembalikan atau kesinambungan pengukuhan semasa. Sentiasa sahkan isyarat ini dengan penunjuk teknikal lain seperti purata bergerak, osilator, dan corak lilin untuk perdagangan dengan kebarangkalian lebih tinggi. Selain itu, beri perhatian rapat kepada acara berita dan pelepasan data ekonomi, kerana ini boleh memberi impak besar kepada harga emas dan membatalkan setup teknikal semata-mata. Pengurusan risiko adalah sangat penting; jangan sekali-kali mempertaruhkan lebih daripada peratusan kecil modal dagangan anda pada mana-mana perdagangan tunggal.
Ringkasan
Ulasan pelanggan
5 | 100 % | |
4 | 0 % | |
3 | 0 % | |
2 | 0 % | |
1 | 0 % |


![Logo "Smart Money Concepts (SMC) [Iridio Capital]"](https://cdn.ctrader.com/image/webp/28b69fd1-ef54-4bed-9487-07e78e883be4_40934)

