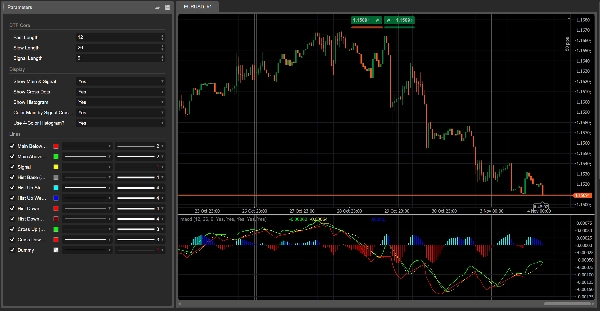
"Dynamic Trend Flux" โลโก้
Dynamic Trend Flux
"Dynamic Trend Flux" ภาพที่อัปโหลด
42.1M
ปริมาณการเทรด
6.13M
Pips ที่ได้กำไร
136
การขาย
5.78K
ติดตั้งฟรี

Dynamic Trend Flux
Type: Momentum / trend oscillator (MACD-style, multi-color)

What it does

Dynamic Trend Flux is a colored momentum oscillator based on the classic fast/slow EMA difference plus a signal line.
It helps you see at a glance:

  • when momentum is bullish or bearish,
  • whether momentum is strengthening or weakening,
  • and where trend shifts occur (crosses of main vs signal line).

The indicator draws:

  1. Main line (Flux line)
    • built from the difference between a fast and a slow EMA
    • changes color depending on whether it is above or below the signal line (optional).
  2. Signal line
    • a moving average of the main line, used as a smoother trigger.
  3. Histogram with 4 colors (optional)
    • shows the distance between main and signal,
    • color encodes both direction (above/below zero) and change of strength from bar to bar.
  4. Dots on crosses (optional)
    • highlights where the main line crosses the signal line → potential trend phase changes.

All calculations are performed on the current chart timeframe.


How to read it

1. Zero line

  • Values above zero → bullish pressure dominates.
  • Values below zero → bearish pressure dominates.

2. Colored histogram

With 4-color mode ON:

  • Aqua → above zero and rising
    • strong / increasing bullish momentum.
  • Blue → above zero but falling
    • bullish trend still on, but momentum cooling down.
  • Red → below zero and falling
    • strong / increasing bearish momentum.
  • Maroon → below zero but rising
    • bearish phase still on, but momentum losing strength.

This makes divergences and momentum shifts much easier to spot visually.

3. Main & Signal lines

  • Main line above Signal → bullish phase.
  • Main line below Signal → bearish phase.

If color-change is enabled:

  • Main line Lime = above Signal (bullish control)
  • Main line Red = below Signal (bearish control)

4. Cross dots

  • Green dot (Cross Up) → main crosses above signal
    • possible start of a bullish swing.
  • Red dot (Cross Down) → main crosses below signal
    • possible start of a bearish swing.

Always combine these signals with structure / price action and higher-timeframe context.


Parameters (English)

DTF Core

  • Fast Length – period of the fast EMA (default 12).
  • Slow Length – period of the slow EMA (default 26).
  • Signal Length – period of the signal SMA applied to the main line (default 9).

Display

  • Show Main & Signal – toggles the two lines.
  • Show Cross Dots – show dots on main/signal crossings.
  • Show Histogram – toggles the histogram behind.
  • Color Main by Signal Cross?
    • ON → main line Lime above signal, Red below.
    • OFF → main line stays Red.
  • Use 4-Color Histogram?
    • ON → aqua / blue / red / maroon logic.
    • OFF → histogram is a single gray color.
Indicator profile
0.0
รีวิว: 0
รีวิวจากลูกค้า
ยังไม่มีรีวิวสำหรับผลิตภัณฑ์นี้ หากเคยลองแล้ว ขอเชิญมาเป็นคนแรกที่บอกคนอื่น!
Signal
Indices
Commodities
GBPUSD
MACD
Bollinger
Scalping
Supertrend
AI
XAUUSD
NAS100
BTCUSD
Forex
Breakout
RSI
EURUSD
NZDUSD
Fibonacci
Martingale
VWAP
Prop
ZigZag
ATR
SMC
Crypto
Grid
Stocks
Fair Value Gap (FVG)
USDJPY
Products available through cTrader Store, including trading bots, indicators and plugins, are provided by third-party developers and made available for informational and technical access purposes only. cTrader Store is not a broker and does not provide investment advice, personal recommendations or any guarantee of future performance.

เพิ่มเติมจากผู้เขียนคนนี้

Read aggressive flow in real time. Flexible resets (Day/Week/Month), optional EMA smoothing, and non-repainting cumulati
The Prop-Ready Bot The Definitive Automaton for Challenges 🛡️ V2.0
Editions: Free (core VWAP + bands) · Pro (multi‑VWAP, click‑to‑anchor, alerts).
"Breakout Premium Pro v2.0" โลโก้
5.0
(1)
$ 49
/
$97
A price-action-first algorithm to trade Breakout, Approach, and Return around prior High/Low levels—with Prop-style risk
Volume Bubbles is a lightweight yet powerful visual indicator for cTrader
"ElliottWave Pro cBot" โลโก้
5.0
(1)
$ 69
/
$99
The Elliott Wave Pro Bot is a sophisticated and highly configurable algorithmic trading system
N.B.: Results with an initial invested capital of 100 euros.
"Scalper Pro PROP" โลโก้
4.0
(1)
$ 49
/
$89
Breakout scalping with prop-firm grade equity control.
Want a cBot based on this indicator? Contact us!
"AI Level Trader" โลโก้
$ 129
/
$159
AILevelTrader — Multi-AI Consensus Trading Bot 11 AI providers. One consensus. Prop Firm Ready.
1.9
อัตราส่วน กำไรต่อขาดทุน
4%
Drawdown สูงสุด
ZigZag Free is a clean swing-detection tool that marks significant pivot highs/lows
"TradeCopierBot" โลโก้
$ 69
/
$119
✅ Buy 3 prop accounts and manage just 1: cut management effort by 66% with a professional tool.

นอกจากนี้คุณยังอาจชอบ

Block Liquidity,indicator.Block Order, Liquids Stops, Signal Sentiment,signal correction
"BarCount" โลโก้
4.5
(2)
ฟรี
Bar count
ICT Breakers (BOS/MSS) - Professional market structure and breakout detection tool.
"Supertrend Indicator v1.1" โลโก้
5.0
(1)
$ 19
/
$30
Supertrend Indicator
Bring the RMA to cTrader! This is the Relative Moving Average from TradingView.
Pure Price Action ICT Tools
AI Quantum Trading Edge: Your Intelligent Trading Assistant
Market Session Indicator
🎯Generate precise BUY/SELL signals. 📈🎯 Tracks trends with colored candles & clouds.
"ZigZag" โลโก้
4.3
(6)
ฟรี
ZigZag filters noise, spots trends, patterns, pivots, aiding analysis, trade management, and confirmations. 📉📈
Track the Movement of Market Assets with an Oscillator Scanner in Real-Time!
Auto Fibonacci Retracement Indicator.
"Advanced VSA & CVD indicator with 'A+ Setup' filtering based on Support & Resistance levels."
Auto-detects Bullish/Bearish Engulfing patterns to spot trend reversals. Real-time alerts, custom colors, all symbols.
Heatmap of intra-HTF volume (POC/VA) built from LTF tick data; paints current candle and auto-loads visible history.
Premium Discount Zones" spots key areas (🟣Premium/🟢Discount) using recent highs/lows & volume..............
KST Momentum Heatwave — Turn Momentum Into Market Temperature (On-Chart)
Professional Volume Profile Indicator - Shows volume distribution, POC, Value Areas & Buy/Sell pressure.
42.1M
ปริมาณการเทรด
6.13M
Pips ที่ได้กำไร
136
การขาย
5.78K
ติดตั้งฟรี