Beschreibung
Profi-VWAP, der immer auf M1-Daten berechnet—egal, auf welchem Chart Sie sich befinden—und gleichzeitig tägliche, wöchentliche und monatliche Anker mit optionalen Bändern und vollständig editierbaren Farben & Stärken darstellt.
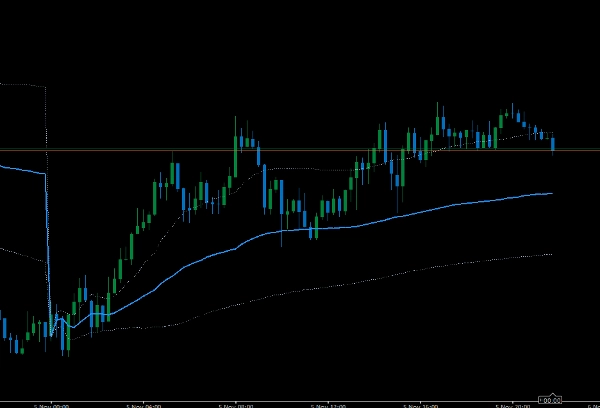
Kompatibel mit Renko- und Heikin-Ashi-Charts
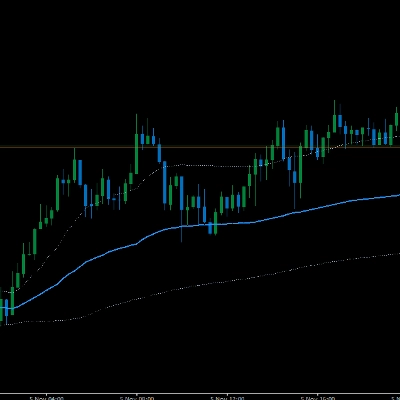
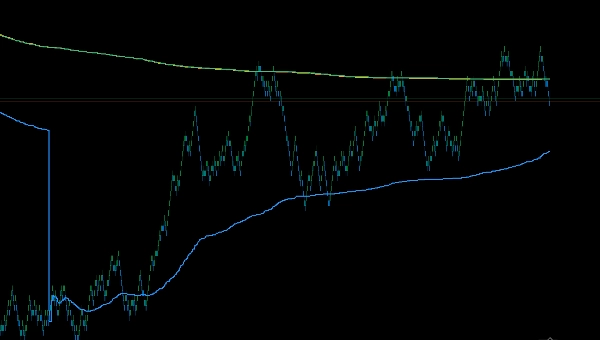
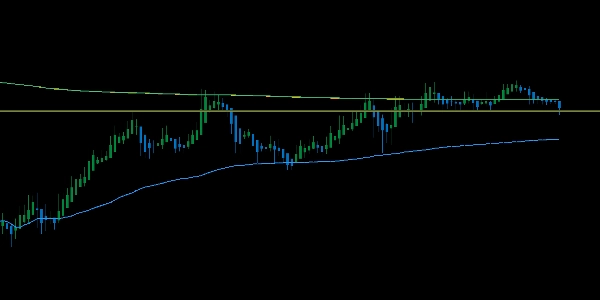
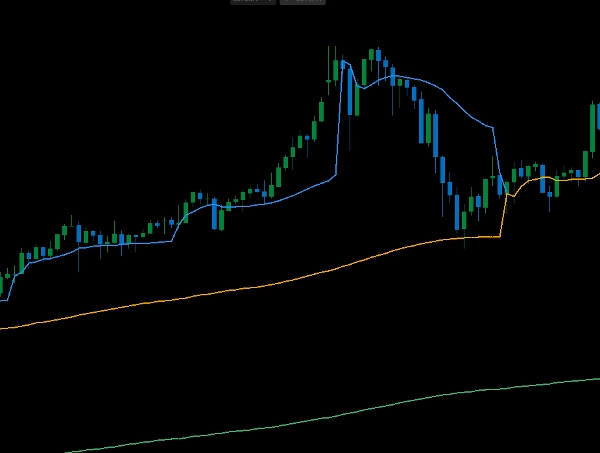
Multi-Anchored VWAP (M1 Engine)
Ein präziser VWAP, entwickelt für Trader, die genaue Verankerung und klare Visualisierungen verlangen. Der Indikator verwendet intern 1-Minuten-Bars für seine Berechnungen, sodass Sie auf jedem Zeitrahmen oder Charttyp (Zeit, Tick, Range, Renko, Heikin-Ashi) handeln oder ansehen können – Ihre VWAPs bleiben konsistent.
Hauptmerkmale
- Echte M1 VWAP-Engine: Berechnungen basieren auf 1-Minuten-Daten für konsistente Ergebnisse über alle Charts hinweg.
- 3 Anker gleichzeitig: Täglich, Wöchentlich, Monatlich—perfekt für institutionelle Niveaus und Multi-Frame-Kongruenz.
- Bänder pro Anker an/aus: Bänder umschalten und einen Multiplikator pro Zeitrahmen einstellen (0 = ausblenden).
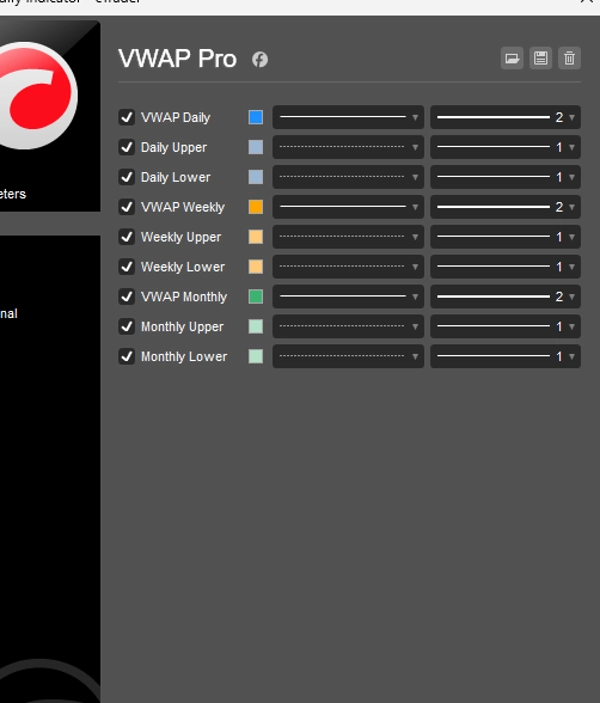
- Stil Ihrer Linien: Farbe und Stärke für jeden VWAP direkt in den Indikatoreinstellungen bearbeiten.
- Intelligente Rücksetzungen: automatische Tages-/Wochen-/Monatsgrenzen (ISO/Montagswoche), kein manuelles Eingreifen nötig.
- Leichtgewichtig: optimierte kumulative Berechnungen; minimaler CPU-Verbrauch.
Warum Sie es mögen werden
- Handeln Sie jeden Chart/Zeitfenster ohne VWAP-Drift.
- Sehen Sie Wertbereiche höherer Zeitrahmen auf einen Blick.
- Sauberes, konfigurierbares Aussehen, das zu Ihrer Vorlage passt.
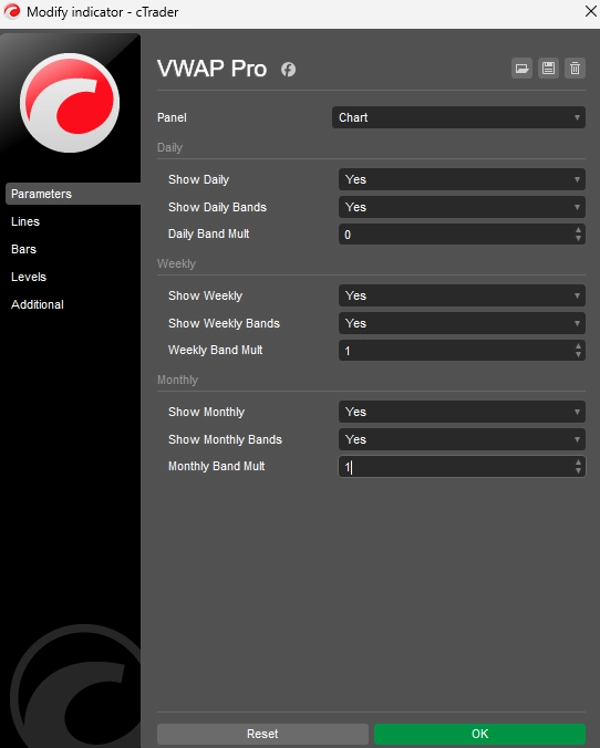
Eingaben (schnell)
- Sichtbarkeit: Täglich / Wöchentlich / Monatlich anzeigen
- Bänder: Tägliche/Wöchentliche/Monatliche Bänder anzeigen, Bandmultiplikator pro Anker
- Styling: pro Anker Farbe & Stärke (über Ausgabestile)
Hinweise
- Erfordert Broker-M1-Historie; erste Bars können
NaNanzeigen, bis genügend M1-Daten geladen sind. - Verwendet TickVolume Gewichtung (universell verfügbar bei cTrader-Symbolen).
Am besten geeignet für
Scalper, Intraday- und Swing-Trader, die Einstiege mit Session-/Tag-/Woche-/Monat-VWAP und Standardabweichungsbändern abstimmen.
Dies ist keine Finanzberatung, es ist ein benutzerdefinierter Indikator, den ich verwende und von dem ich denke, dass er für jemand anderen nützlich sein könnte.
Ihre Ergebnisse liegen in Ihrer Verantwortung.
Zusammenfassung
Kundenbewertungen
5 | 0 % | |
4 | 100 % | |
3 | 0 % | |
2 | 0 % | |
1 | 0 % |


